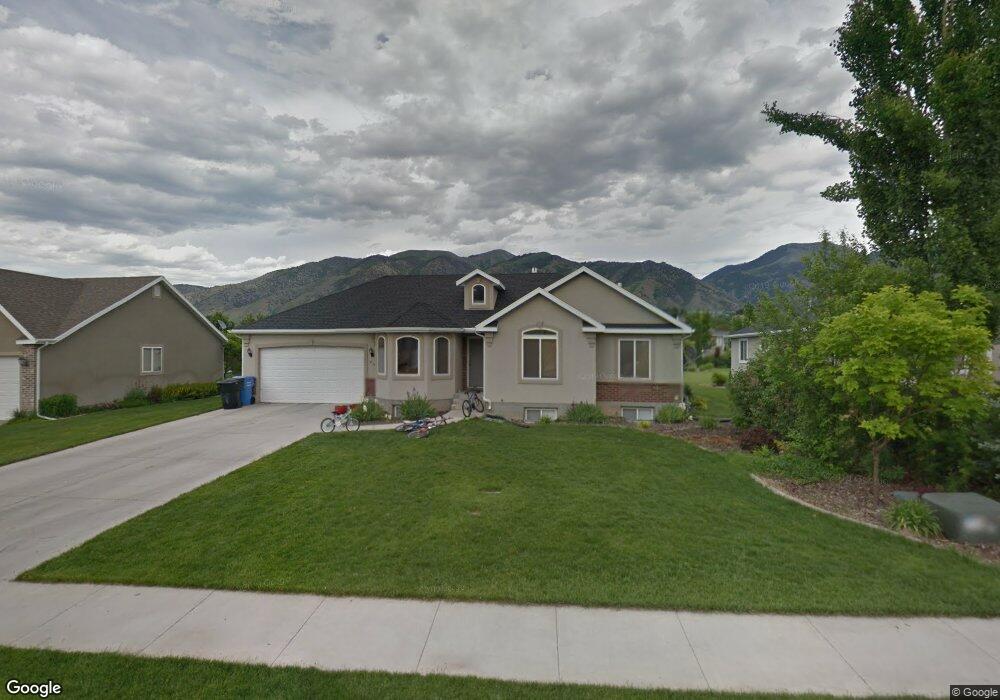
254 S 375 W Providence, UT 84332
Estimated Value: $506,000 - $544,814
6
Beds
3
Baths
2,836
Sq Ft
$185/Sq Ft
Est. Value
About This Home
This home is located at 254 S 375 W, Providence, UT 84332 and is currently estimated at $525,204, approximately $185 per square foot. 254 S 375 W is a home located in Cache County with nearby schools including River Heights School, Spring Creek Middle School, and South Cache Middle School.
Ownership History
Date
Name
Owned For
Owner Type
Purchase Details
Closed on
Mar 17, 2017
Sold by
Budge Tyson and Budge Ressa D
Bought by
Cole Frank L and Cole Heidi H
Current Estimated Value
Home Financials for this Owner
Home Financials are based on the most recent Mortgage that was taken out on this home.
Original Mortgage
$235,200
Outstanding Balance
$193,992
Interest Rate
4.15%
Mortgage Type
New Conventional
Estimated Equity
$331,212
Purchase Details
Closed on
Aug 22, 2001
Sold by
Jaren Taylor Construction Inc
Bought by
Budge Tyson and Budge Ressa D
Home Financials for this Owner
Home Financials are based on the most recent Mortgage that was taken out on this home.
Original Mortgage
$125,000
Interest Rate
7.21%
Purchase Details
Closed on
Mar 2, 2001
Sold by
Foxridge Development Co
Bought by
Jaren Taylor Construction Inc
Create a Home Valuation Report for This Property
The Home Valuation Report is an in-depth analysis detailing your home's value as well as a comparison with similar homes in the area
Home Values in the Area
Average Home Value in this Area
Purchase History
| Date | Buyer | Sale Price | Title Company |
|---|---|---|---|
| Cole Frank L | -- | Cache Title | |
| Budge Tyson | -- | Cache Title Company | |
| Jaren Taylor Construction Inc | -- | Cache Title Company |
Source: Public Records
Mortgage History
| Date | Status | Borrower | Loan Amount |
|---|---|---|---|
| Open | Cole Frank L | $235,200 | |
| Previous Owner | Budge Tyson | $125,000 |
Source: Public Records
Tax History Compared to Growth
Tax History
| Year | Tax Paid | Tax Assessment Tax Assessment Total Assessment is a certain percentage of the fair market value that is determined by local assessors to be the total taxable value of land and additions on the property. | Land | Improvement |
|---|---|---|---|---|
| 2025 | $2,063 | $289,255 | $0 | $0 |
| 2024 | $2,205 | $287,625 | $0 | $0 |
| 2023 | $2,325 | $285,765 | $0 | $0 |
| 2022 | $2,095 | $243,145 | $0 | $0 |
| 2021 | $2,059 | $366,160 | $62,500 | $303,660 |
| 2020 | $2,130 | $351,300 | $62,500 | $288,800 |
| 2019 | $2,250 | $351,299 | $62,500 | $288,799 |
| 2018 | $1,967 | $313,630 | $62,500 | $251,130 |
| 2017 | $1,791 | $151,140 | $0 | $0 |
| 2016 | $1,811 | $132,330 | $0 | $0 |
| 2015 | $1,368 | $113,930 | $0 | $0 |
| 2014 | $1,335 | $113,930 | $0 | $0 |
| 2013 | -- | $113,930 | $0 | $0 |
Source: Public Records
Map
Nearby Homes