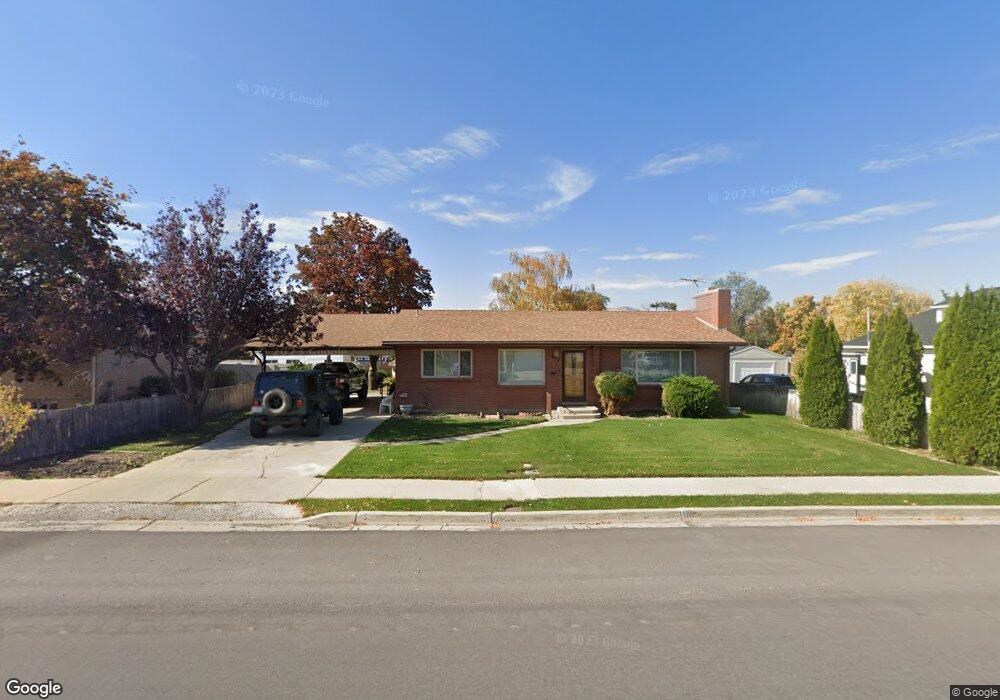
254 S 500 W Payson, UT 84651
Estimated Value: $435,000 - $495,000
2
Beds
3
Baths
1,320
Sq Ft
$352/Sq Ft
Est. Value
About This Home
This home is located at 254 S 500 W, Payson, UT 84651 and is currently estimated at $464,803, approximately $352 per square foot. 254 S 500 W is a home located in Utah County with nearby schools including Wilson Elementary School, Mt. Nebo Junior High School, and Mt. Nebo Middle.
Ownership History
Date
Name
Owned For
Owner Type
Purchase Details
Closed on
Aug 22, 2000
Sold by
Holt Sally M and Holt Val Douglas
Bought by
Holt Sally M and Holt Val Douglas
Current Estimated Value
Purchase Details
Closed on
Jun 1, 1999
Sold by
D J Elite Development Llc
Bought by
Jones Shawn Adam and Jones Jody Lymnan
Home Financials for this Owner
Home Financials are based on the most recent Mortgage that was taken out on this home.
Original Mortgage
$137,809
Interest Rate
6.84%
Create a Home Valuation Report for This Property
The Home Valuation Report is an in-depth analysis detailing your home's value as well as a comparison with similar homes in the area
Home Values in the Area
Average Home Value in this Area
Purchase History
| Date | Buyer | Sale Price | Title Company |
|---|---|---|---|
| Holt Sally M | -- | -- | |
| Jones Shawn Adam | -- | First American Title Co |
Source: Public Records
Mortgage History
| Date | Status | Borrower | Loan Amount |
|---|---|---|---|
| Previous Owner | Jones Shawn Adam | $137,809 |
Source: Public Records
Tax History Compared to Growth
Tax History
| Year | Tax Paid | Tax Assessment Tax Assessment Total Assessment is a certain percentage of the fair market value that is determined by local assessors to be the total taxable value of land and additions on the property. | Land | Improvement |
|---|---|---|---|---|
| 2025 | $2,235 | $245,630 | $140,700 | $305,900 |
| 2024 | $2,235 | $227,425 | $0 | $0 |
| 2023 | $2,258 | $230,395 | $0 | $0 |
| 2022 | $2,288 | $229,680 | $0 | $0 |
| 2021 | $1,903 | $306,400 | $103,400 | $203,000 |
| 2020 | $1,778 | $280,000 | $89,900 | $190,100 |
| 2019 | $1,634 | $263,800 | $77,700 | $186,100 |
| 2018 | $1,460 | $227,200 | $65,400 | $161,800 |
| 2017 | $1,338 | $111,980 | $0 | $0 |
| 2016 | $1,204 | $100,155 | $0 | $0 |
| 2015 | $1,175 | $97,020 | $0 | $0 |
| 2014 | $1,051 | $87,395 | $0 | $0 |
Source: Public Records
Map
Nearby Homes