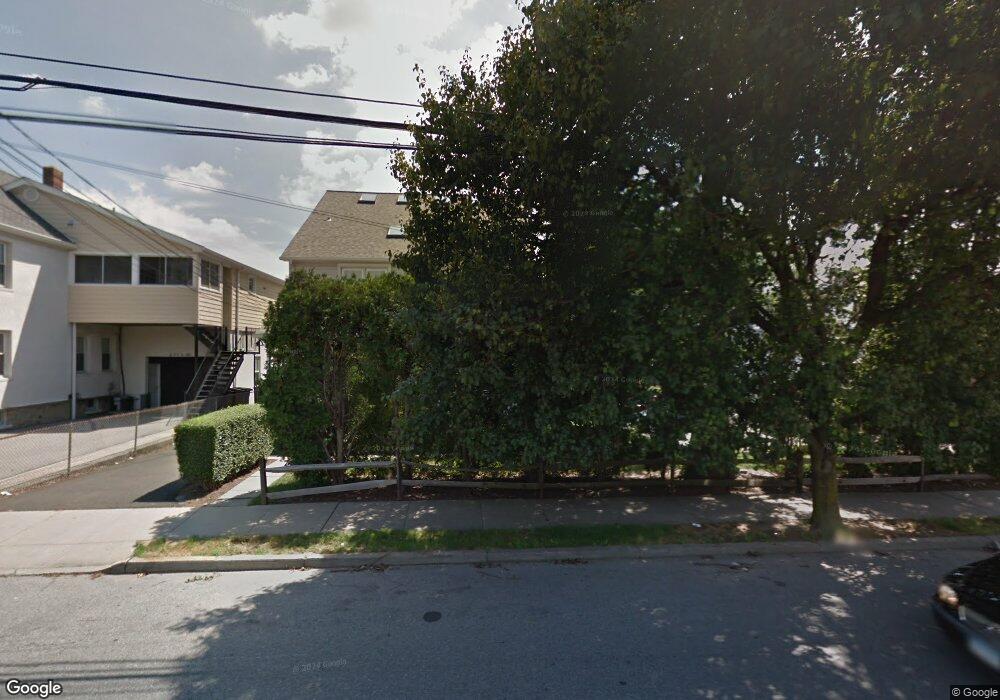
254 Seaside Ave Unit 266B Stamford, CT 06902
The Cove NeighborhoodEstimated Value: $511,000 - $550,000
2
Beds
2
Baths
1,852
Sq Ft
$289/Sq Ft
Est. Value
About This Home
This home is located at 254 Seaside Ave Unit 266B, Stamford, CT 06902 and is currently estimated at $536,078, approximately $289 per square foot. 254 Seaside Ave Unit 266B is a home located in Fairfield County with nearby schools including K. T. Murphy Elementary School, Rippowam Middle School, and Stamford High School.
Ownership History
Date
Name
Owned For
Owner Type
Purchase Details
Closed on
Sep 24, 2024
Sold by
Wechgelaer Steven S
Bought by
Thungthongsuai Saowalak
Current Estimated Value
Purchase Details
Closed on
Dec 28, 1993
Sold by
Nash Frank
Bought by
Wechgelear Steven
Home Financials for this Owner
Home Financials are based on the most recent Mortgage that was taken out on this home.
Original Mortgage
$120,000
Interest Rate
7%
Mortgage Type
Unknown
Purchase Details
Closed on
Jul 19, 1988
Sold by
Pellow Barbara
Bought by
Merrill Lynch Rlty Op
Purchase Details
Closed on
Aug 18, 1987
Sold by
Bidinger Jerome
Bought by
Pellow Barbara
Home Financials for this Owner
Home Financials are based on the most recent Mortgage that was taken out on this home.
Original Mortgage
$150,000
Interest Rate
10.4%
Create a Home Valuation Report for This Property
The Home Valuation Report is an in-depth analysis detailing your home's value as well as a comparison with similar homes in the area
Home Values in the Area
Average Home Value in this Area
Purchase History
| Date | Buyer | Sale Price | Title Company |
|---|---|---|---|
| Thungthongsuai Saowalak | $500,000 | None Available | |
| Thungthongsuai Saowalak | $500,000 | None Available | |
| Wechgelear Steven | $155,000 | -- | |
| Wechgelear Steven | $155,000 | -- | |
| Merrill Lynch Rlty Op | $228,000 | -- | |
| Pellow Barbara | $235,000 | -- |
Source: Public Records
Mortgage History
| Date | Status | Borrower | Loan Amount |
|---|---|---|---|
| Previous Owner | Pellow Barbara | $120,000 | |
| Previous Owner | Pellow Barbara | $150,000 |
Source: Public Records
Tax History Compared to Growth
Tax History
| Year | Tax Paid | Tax Assessment Tax Assessment Total Assessment is a certain percentage of the fair market value that is determined by local assessors to be the total taxable value of land and additions on the property. | Land | Improvement |
|---|---|---|---|---|
| 2025 | $6,589 | $275,450 | $0 | $275,450 |
| 2024 | $6,435 | $275,450 | $0 | $275,450 |
| 2023 | $6,952 | $275,450 | $0 | $275,450 |
| 2022 | $6,656 | $244,970 | $0 | $244,970 |
| 2021 | $6,599 | $244,970 | $0 | $244,970 |
| 2020 | $6,455 | $244,970 | $0 | $244,970 |
| 2019 | $6,455 | $244,970 | $0 | $244,970 |
| 2018 | $6,254 | $244,970 | $0 | $244,970 |
| 2017 | $5,638 | $209,670 | $0 | $209,670 |
| 2016 | $5,477 | $209,670 | $0 | $209,670 |
| 2015 | $5,332 | $209,670 | $0 | $209,670 |
| 2014 | -- | $209,670 | $0 | $209,670 |
Source: Public Records
Map
Nearby Homes
- 33 Dora St
- 214 Seaside Ave
- 214 Seaside Ave Unit 2
- 209 Seaside Ave Unit 2
- 16 Neponsit St
- 114 Sylvan Knoll Rd
- 175 Seaside Ave Unit 1
- 737 Cove Rd Unit D2
- 28 Aquila Rd
- 421 Sylvan Knoll Rd
- 697 Cove Rd Unit 1E
- 697 Cove Rd Unit 2A
- 274 Sylvan Knoll Rd
- 55 Avery St
- 171 Sylvan Knoll Rd
- 120 Webb Ave
- 203 Sylvan Knoll Rd
- 15 Robin St
- 11 Willowbrook Ct Unit 11
- 105 Houston Terrace
- 254 Seaside Ave
- 254 Seaside Ave Unit 34D
- 254 Seaside Ave Unit 34B
- 254 Seaside Ave Unit 34A
- 254 Seaside Ave Unit 266D
- 254 Seaside Ave Unit 266C
- 254 Seaside Ave Unit 266A
- 254 Seaside Ave Unit F
- 254 Seaside Ave Unit E
- 254 Seaside Ave Unit D
- 254 Seaside Ave Unit C
- 254 Seaside Ave Unit B
- 254 Seaside Ave Unit A
- 254 Seaside Ave Unit F
- 254 Seaside Ave Unit A
- 254 Seaside Ave Unit F
- 252 Seaside Ave
- 252 Seaside Ave Unit 1st FL
- 266 Seaside Ave Unit B
- 268 Seaside Ave