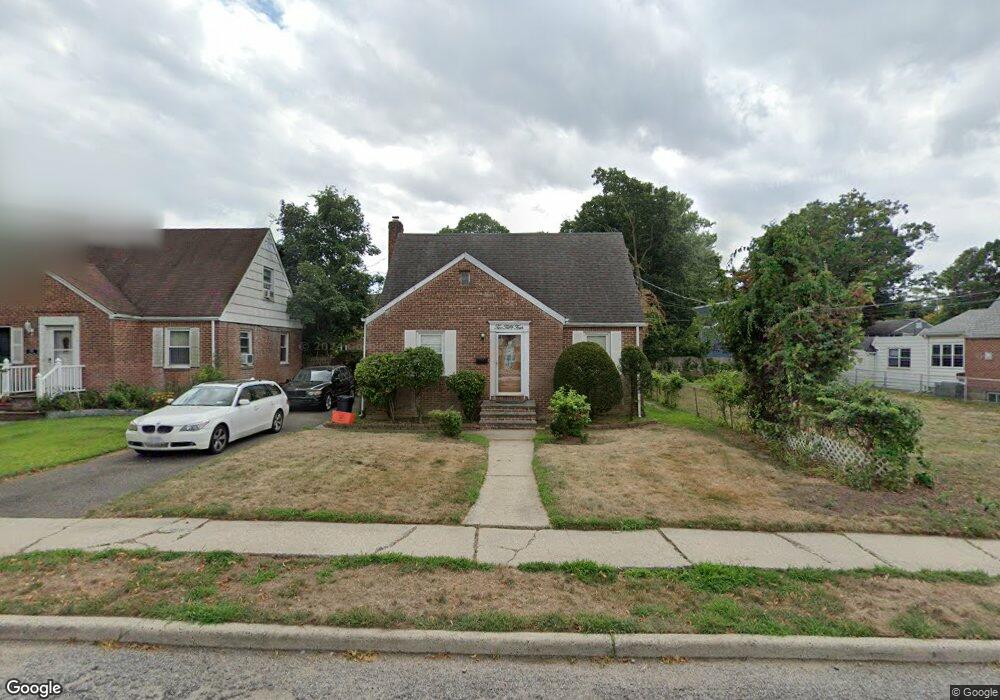
254 Sylvan Dr West Hempstead, NY 11552
Estimated Value: $469,000 - $724,566
--
Bed
1
Bath
1,334
Sq Ft
$447/Sq Ft
Est. Value
About This Home
This home is located at 254 Sylvan Dr, West Hempstead, NY 11552 and is currently estimated at $596,783, approximately $447 per square foot. 254 Sylvan Dr is a home located in Nassau County with nearby schools including Chestnut Street School, West Hempstead Middle School, and West Hempstead Secondary School.
Ownership History
Date
Name
Owned For
Owner Type
Purchase Details
Closed on
Sep 8, 2021
Sold by
Oldham Anthony and Oldham Rhina
Bought by
Oldham Anthony
Current Estimated Value
Home Financials for this Owner
Home Financials are based on the most recent Mortgage that was taken out on this home.
Original Mortgage
$54,601
Outstanding Balance
$49,683
Interest Rate
2.8%
Mortgage Type
New Conventional
Estimated Equity
$547,100
Purchase Details
Closed on
Jun 27, 2012
Sold by
Mercado Daniel
Bought by
Oldham Anthony and Oldham Rhina
Home Financials for this Owner
Home Financials are based on the most recent Mortgage that was taken out on this home.
Original Mortgage
$265,109
Outstanding Balance
$183,693
Interest Rate
3.75%
Mortgage Type
FHA
Estimated Equity
$413,090
Purchase Details
Closed on
May 21, 2007
Sold by
Ramirez Erasmo
Bought by
Mercado Daniel
Purchase Details
Closed on
Mar 26, 2003
Sold by
Erato Dawn
Create a Home Valuation Report for This Property
The Home Valuation Report is an in-depth analysis detailing your home's value as well as a comparison with similar homes in the area
Home Values in the Area
Average Home Value in this Area
Purchase History
| Date | Buyer | Sale Price | Title Company |
|---|---|---|---|
| Oldham Anthony | -- | Judicial Title | |
| Oldham Anthony | $270,000 | Preferred Abstract Corp | |
| Mercado Daniel | $380,000 | -- | |
| -- | $292,000 | -- |
Source: Public Records
Mortgage History
| Date | Status | Borrower | Loan Amount |
|---|---|---|---|
| Open | Oldham Anthony | $54,601 | |
| Open | Oldham Anthony | $265,109 |
Source: Public Records
Tax History Compared to Growth
Tax History
| Year | Tax Paid | Tax Assessment Tax Assessment Total Assessment is a certain percentage of the fair market value that is determined by local assessors to be the total taxable value of land and additions on the property. | Land | Improvement |
|---|---|---|---|---|
| 2025 | $11,503 | $450 | $202 | $248 |
| 2024 | $3,844 | $450 | $202 | $248 |
| 2023 | $11,527 | $450 | $202 | $248 |
| 2022 | $11,527 | $450 | $202 | $248 |
| 2021 | $16,447 | $430 | $193 | $237 |
| 2020 | $13,205 | $852 | $560 | $292 |
| 2019 | $14,058 | $852 | $560 | $292 |
| 2018 | $13,148 | $852 | $0 | $0 |
| 2017 | $7,703 | $852 | $560 | $292 |
| 2016 | $11,807 | $852 | $560 | $292 |
| 2015 | $3,476 | $776 | $560 | $216 |
| 2014 | $3,476 | $776 | $560 | $216 |
| 2013 | $3,256 | $776 | $560 | $216 |
Source: Public Records
Map
Nearby Homes
- 853 Arthur St
- 899 Cleveland St
- 841 Harrison St
- 450 Rhodes Ln
- 0 Rhodes Ln
- 757 Harrison St
- 1010 Hempstead Ave
- 618 Wall St
- 771 Maple Place
- 841 Woodfield Rd
- 729 Janos Ln
- 747 Janos Ln
- 924 Otsego Ct
- 10 Atlas Ave
- 350 Coventry Rd N
- 55 Melvin Ave
- 919 Pinelake Dr
- 670 Hempstead Ave
- 516 Washington Ave
- 966 Woodfield Rd
- 258 Sylvan Dr
- 250 Sylvan Dr
- 290 Sylvan Dr
- 0 Sylvan Dr Unit P1294023
- 251 Patton Place
- 266 Sylvan Dr
- 885 Eisenhower Dr
- 756 Paramount Ct
- 750 Paramount Ct
- 257 Patton Place
- 895 Eisenhower Dr
- 255 Sylvan Dr
- 270 Sylvan Dr
- 259 Sylvan Dr
- 263 Patton Place
- 253 Sylvan Dr
- 265 Sylvan Dr
- 249 Sylvan Dr
- 884 Eisenhower Dr
- 274 Sylvan Dr