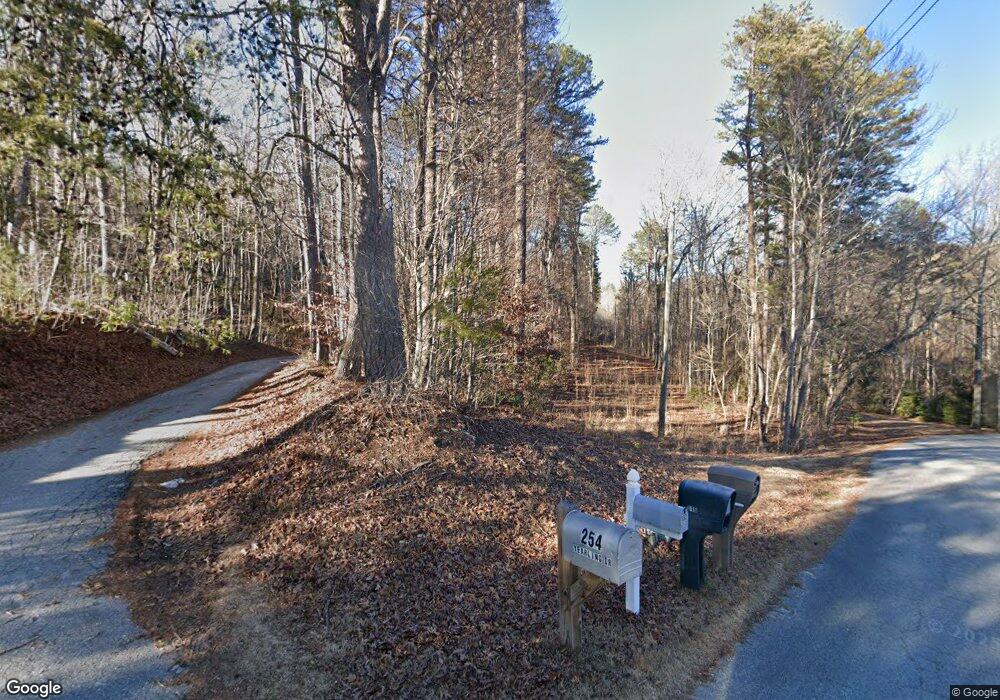
254 Yearling Dr Clayton, GA 30525
Estimated Value: $358,000 - $696,000
2
Beds
2
Baths
2,830
Sq Ft
$187/Sq Ft
Est. Value
About This Home
This home is located at 254 Yearling Dr, Clayton, GA 30525 and is currently estimated at $528,973, approximately $186 per square foot. 254 Yearling Dr is a home with nearby schools including Rabun County Primary School and Rabun County High School.
Ownership History
Date
Name
Owned For
Owner Type
Purchase Details
Closed on
Nov 16, 2018
Sold by
Messer Matthew B
Bought by
Messer Matthew B and Messer Linda Lauren
Current Estimated Value
Create a Home Valuation Report for This Property
The Home Valuation Report is an in-depth analysis detailing your home's value as well as a comparison with similar homes in the area
Home Values in the Area
Average Home Value in this Area
Purchase History
| Date | Buyer | Sale Price | Title Company |
|---|---|---|---|
| Messer Matthew B | -- | -- | |
| Messer Matthew B | -- | -- |
Source: Public Records
Tax History Compared to Growth
Tax History
| Year | Tax Paid | Tax Assessment Tax Assessment Total Assessment is a certain percentage of the fair market value that is determined by local assessors to be the total taxable value of land and additions on the property. | Land | Improvement |
|---|---|---|---|---|
| 2024 | $2,074 | $129,240 | $11,657 | $117,583 |
| 2023 | $2,204 | $120,420 | $10,972 | $109,448 |
| 2022 | $2,117 | $115,667 | $10,286 | $105,381 |
| 2021 | $1,071 | $57,126 | $9,600 | $47,526 |
| 2020 | $1,011 | $52,144 | $9,600 | $42,544 |
| 2019 | $1,019 | $52,144 | $9,600 | $42,544 |
| 2018 | $665 | $33,911 | $9,600 | $24,311 |
| 2017 | $211 | $33,911 | $9,600 | $24,311 |
| 2016 | $211 | $11,176 | $10,972 | $204 |
Source: Public Records
Map
Nearby Homes
- 322 Westwind Trail
- 623 Deerfield Dr
- 341 Abby Ln
- 595 Jim McCrackin Rd
- LOT 99 Cypress Ct Unit Lot 99
- LOT 87 Forest Glen Ct Unit Lot 87
- 66 Post Oak St
- 172 Fred Henry Ln
- 1063 Rickman Airfield Rd
- 0 Seed Tick Rd Unit 412718
- 0 Celestial Cir Unit 10590466
- 0 Celestial Cir Unit LOT 22 10564672
- LOT 153 King Mountain Rd Unit LOT 153
- 4528 Highway 76 W
- 0 Sequoia Hills Ln Unit 7656465
- 0 Sequoia Hills Ln Unit 419126
- 0 Sequoia Hills Ln Unit 10613618
- 0 King Mtn Dr Unit 10203369
- 1760 Rickman Airfield Rd
- 0 Heavenly Cir Unit 10615813
- 239 Yearling Dr
- 18 Westwind Trail
- 18 Westwind Trail Unit 18
- 0 Yearling Rd Unit 7367749
- 0 Yearling Rd Unit 8832064
- 182 Yearling Dr Unit 8
- 182 Yearling Dr
- 182 Yearling Dr
- 1078 Deerfield Dr
- 0 Westwind Trail Unit 16 7185583
- 0 Westwind Trail Unit 45 9061798
- 0 Westwind Trail Unit 8728754
- 0 Westwind Trail Unit 7191507
- 0 Westwind Trail Unit 8370079
- 0 Westwind Trail Unit 8412412
- 0 Westwind Trail Unit 8557207
- 0 Westwind Trail Unit 16 8663945
- 0 Westwind Trail Unit 45 8529557
- 0 Westwind Trail Unit 8529557
- 221 Westwind Trail