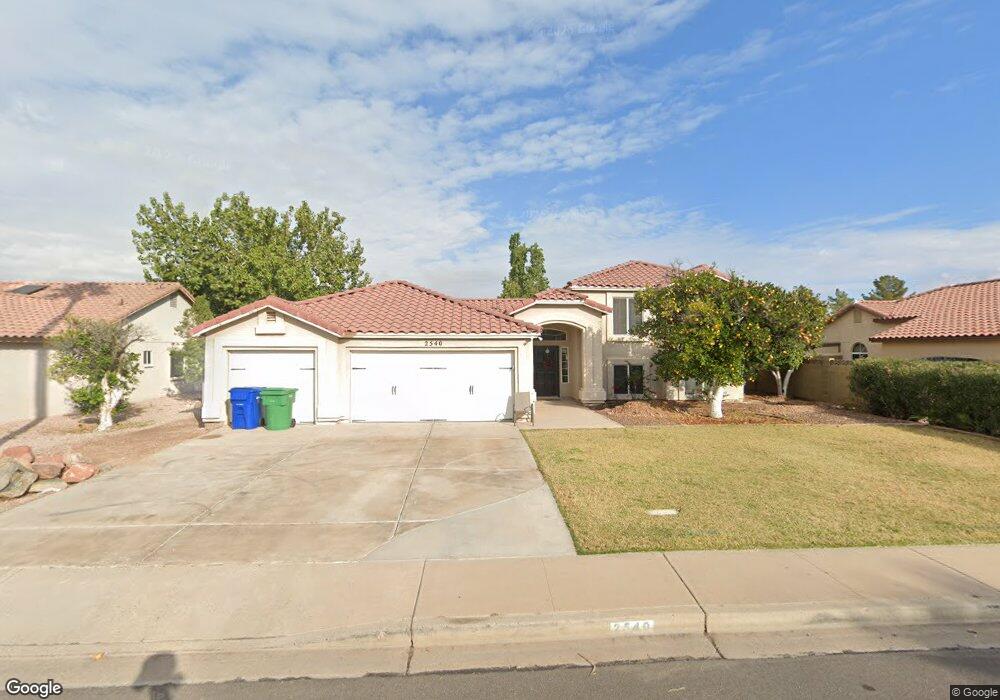
2540 E Lockwood St Unit 3 Mesa, AZ 85213
Rancho de Arboleda NeighborhoodEstimated Value: $609,942 - $656,000
5
Beds
3
Baths
2,408
Sq Ft
$264/Sq Ft
Est. Value
About This Home
This home is located at 2540 E Lockwood St Unit 3, Mesa, AZ 85213 and is currently estimated at $635,986, approximately $264 per square foot. 2540 E Lockwood St Unit 3 is a home located in Maricopa County with nearby schools including Hermosa Vista Elementary School, Franklin at Brimhall Elementary School, and Franklin West Elementary School.
Ownership History
Date
Name
Owned For
Owner Type
Purchase Details
Closed on
Apr 22, 2022
Sold by
Palmer and David
Bought by
Poffenberger Ryan and Poffenberger Alison
Current Estimated Value
Home Financials for this Owner
Home Financials are based on the most recent Mortgage that was taken out on this home.
Original Mortgage
$350,000
Outstanding Balance
$327,707
Interest Rate
4.42%
Mortgage Type
New Conventional
Estimated Equity
$308,279
Purchase Details
Closed on
Sep 30, 2016
Sold by
Lambson Ammon and Lambson Aria J
Bought by
Palmer David and Palmer Roni
Home Financials for this Owner
Home Financials are based on the most recent Mortgage that was taken out on this home.
Original Mortgage
$256,000
Interest Rate
3.43%
Mortgage Type
New Conventional
Purchase Details
Closed on
Aug 4, 2011
Sold by
Wilson Dana F and Wilson Karen Lee
Bought by
Lambson Ammon and Lambson Aria J
Home Financials for this Owner
Home Financials are based on the most recent Mortgage that was taken out on this home.
Original Mortgage
$221,732
Interest Rate
4.75%
Mortgage Type
FHA
Create a Home Valuation Report for This Property
The Home Valuation Report is an in-depth analysis detailing your home's value as well as a comparison with similar homes in the area
Home Values in the Area
Average Home Value in this Area
Purchase History
| Date | Buyer | Sale Price | Title Company |
|---|---|---|---|
| Poffenberger Ryan | $650,000 | New Title Company Name | |
| Palmer David | $320,000 | Chicago Title Agency Inc | |
| Lambson Ammon | $227,500 | Grand Canyon Title Agency In |
Source: Public Records
Mortgage History
| Date | Status | Borrower | Loan Amount |
|---|---|---|---|
| Open | Poffenberger Ryan | $350,000 | |
| Previous Owner | Palmer David | $256,000 | |
| Previous Owner | Lambson Ammon | $221,732 |
Source: Public Records
Tax History
| Year | Tax Paid | Tax Assessment Tax Assessment Total Assessment is a certain percentage of the fair market value that is determined by local assessors to be the total taxable value of land and additions on the property. | Land | Improvement |
|---|---|---|---|---|
| 2025 | $2,391 | $28,503 | -- | -- |
| 2024 | $2,439 | $27,146 | -- | -- |
| 2023 | $2,439 | $41,120 | $8,220 | $32,900 |
| 2022 | $2,387 | $33,010 | $6,600 | $26,410 |
| 2021 | $2,443 | $31,820 | $6,360 | $25,460 |
| 2020 | $2,409 | $29,350 | $5,870 | $23,480 |
| 2019 | $2,235 | $27,430 | $5,480 | $21,950 |
| 2018 | $2,132 | $25,780 | $5,150 | $20,630 |
| 2017 | $2,066 | $25,150 | $5,030 | $20,120 |
| 2016 | $2,388 | $24,850 | $4,970 | $19,880 |
| 2015 | $2,243 | $23,050 | $4,610 | $18,440 |
Source: Public Records
Map
Nearby Homes
- 2566 E Lynwood St
- 2360 N Yale
- 2722 E Lawndale St
- 2528 E Mckellips Rd Unit 116
- 2528 E Mckellips Rd Unit 146
- 2528 E Mckellips Rd Unit 15
- 2435 E Kenwood Cir
- 2728 E Minton St
- 2240 E Kenwood St
- 2334 N Rose
- 2160 E Kenwood St
- 2161 E Menlo Cir
- 2631 E Northridge St
- 2854 E Mallory St
- 2112 E Laurel St
- 2710 N Linda Cir
- 2064 E Kenwood Cir
- 2302 E Northridge St
- 2029 E Lockwood St
- 3026 E Leland St
- 2534 E Lockwood St
- 2550 E Lockwood St
- 2545 E Lynwood St
- 2539 E Lynwood St
- 2553 E Lynwood St
- 2526 E Lockwood St
- 2558 E Lockwood St
- 2543 E Lockwood St
- 2537 E Lockwood St
- 2533 E Lynwood St
- 2551 E Lockwood St
- 2557 E Lynwood St
- 2529 E Lockwood St
- 2559 E Lockwood St
- 2518 E Lockwood St
- 2564 E Lockwood St
- 2525 E Lynwood St
- 2563 E Lynwood St
- 2521 E Lockwood St
- 2536 E Leonora St
Your Personal Tour Guide
Ask me questions while you tour the home.