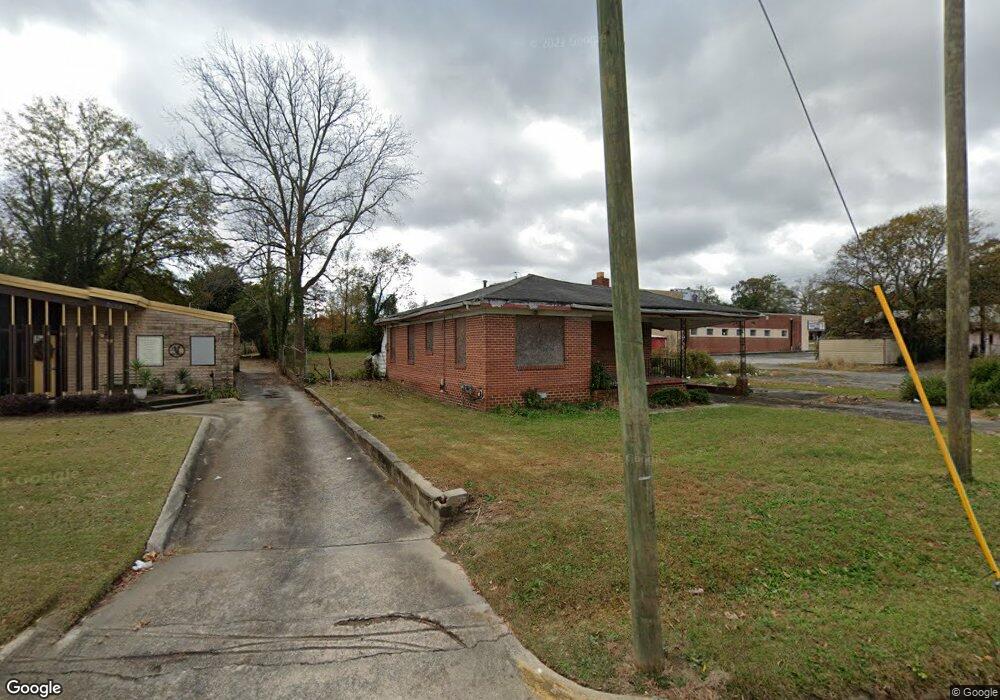
2540 Hillcrest Ave Macon, GA 31204
Estimated Value: $61,786 - $257,000
3
Beds
1
Bath
944
Sq Ft
$130/Sq Ft
Est. Value
About This Home
This home is located at 2540 Hillcrest Ave, Macon, GA 31204 and is currently estimated at $122,447, approximately $129 per square foot. 2540 Hillcrest Ave is a home located in Bibb County with nearby schools including Williams Elementary School, Miller Fine Arts Magnet Middle School, and Central High School.
Ownership History
Date
Name
Owned For
Owner Type
Purchase Details
Closed on
Dec 12, 2024
Sold by
Oshiokpekhai Suprihatin and Oshiokpekhai Evaristus I
Bought by
Oshiokpekhai Irrevocable Family Trust and Oshiokpekhai
Current Estimated Value
Purchase Details
Closed on
Feb 5, 2021
Sold by
Bibb County
Bought by
Oshiokpekhai Evaristus
Purchase Details
Closed on
Nov 28, 2006
Sold by
Oshiokpekhai Evaristus and Oshiokpekhai Suprihatin
Bought by
Dy Gigianni
Purchase Details
Closed on
May 16, 2005
Sold by
Hood Shirley Richards
Bought by
Oshiokpekhai Evaristus and Oshiokpekhai Suprihatt
Purchase Details
Closed on
Sep 20, 2001
Create a Home Valuation Report for This Property
The Home Valuation Report is an in-depth analysis detailing your home's value as well as a comparison with similar homes in the area
Home Values in the Area
Average Home Value in this Area
Purchase History
| Date | Buyer | Sale Price | Title Company |
|---|---|---|---|
| Oshiokpekhai Irrevocable Family Trust | -- | None Listed On Document | |
| Oshiokpekhai Irrevocable Family Trust | -- | None Listed On Document | |
| Oshiokpekhai Evaristus | -- | None Listed On Document | |
| Dy Gigianni | -- | None Avilabale | |
| Oshiokpekhai Evaristus | -- | None Available | |
| -- | $36,000 | -- |
Source: Public Records
Tax History Compared to Growth
Tax History
| Year | Tax Paid | Tax Assessment Tax Assessment Total Assessment is a certain percentage of the fair market value that is determined by local assessors to be the total taxable value of land and additions on the property. | Land | Improvement |
|---|---|---|---|---|
| 2025 | $254 | $10,346 | $10,346 | $0 |
| 2024 | $263 | $10,346 | $10,346 | $0 |
| 2023 | $299 | $11,762 | $8,277 | $3,485 |
| 2022 | $268 | $7,750 | $5,587 | $2,163 |
| 2021 | $295 | $7,750 | $5,587 | $2,163 |
| 2020 | $301 | $7,750 | $5,587 | $2,163 |
| 2019 | $303 | $7,750 | $5,587 | $2,163 |
| 2018 | $645 | $7,750 | $5,587 | $2,163 |
| 2017 | $540 | $14,417 | $5,587 | $8,830 |
| 2016 | $499 | $14,417 | $5,587 | $8,830 |
| 2015 | $706 | $14,417 | $5,587 | $8,830 |
| 2014 | $812 | $14,417 | $5,587 | $8,830 |
Source: Public Records
Map
Nearby Homes
- 2497 Napier Ave
- 2435 Napier Ave
- 2534 Napier Ave
- 2696 Suwanee Ave
- 2485 Beech Ave
- 2686 Napier Ave
- 2334 Napier Ave
- 2713 Suwanee Ave
- 2723 Roy St
- 1148 Hillyer Ave
- 1181 Hendley St
- 1285 Pio Nono Ave
- 2753 Roy St
- 1198 Winton Ave
- 1340 Courtland Ave
- 198 Pio Nono Ave
- 2773 Beech Ave
- 2793 Suwanee Ave
- 2079 E Napier Ave
- 911 Patterson St
- 923 Patterson St
- 865 Patterson St
- 933 Patterson St
- 853 Patterson St
- 841 Patterson St
- 831 Patterson St
- 862 Patterson St
- 2605 Cherokee Ave
- 932 Patterson St
- 848 Patterson St
- 2613 Cherokee Ave
- 826 Patterson St
- 948 Patterson St
- 816 Patterson St
- 960 Patterson St
- 2601 Hillcrest Ave
- 2509 Randall Place
- 806 Patterson St
- 2621 Cherokee Ave