2540 Howards Bridge Rd Union Grove, NC 28689
Estimated Value: $758,000 - $1,827,559
4
Beds
2
Baths
1,995
Sq Ft
$585/Sq Ft
Est. Value
About This Home
This home is located at 2540 Howards Bridge Rd, Union Grove, NC 28689 and is currently estimated at $1,166,186, approximately $584 per square foot. 2540 Howards Bridge Rd is a home located in Yadkin County with nearby schools including Whispering Pines Christian Day School.
Ownership History
Date
Name
Owned For
Owner Type
Purchase Details
Closed on
Apr 1, 2021
Sold by
Futrell Jimmy Bart and Futrell Keri T
Bought by
Yoder Owen and Yoder Rachel
Current Estimated Value
Home Financials for this Owner
Home Financials are based on the most recent Mortgage that was taken out on this home.
Original Mortgage
$900,000
Outstanding Balance
$345,557
Interest Rate
2.8%
Mortgage Type
Seller Take Back
Estimated Equity
$820,629
Purchase Details
Closed on
Aug 31, 2007
Sold by
Bowman Donna I and Irwin Elnora G
Bought by
Futrell Jimmy B and Futrell Keri T
Home Financials for this Owner
Home Financials are based on the most recent Mortgage that was taken out on this home.
Original Mortgage
$300,000
Interest Rate
6.62%
Mortgage Type
Future Advance Clause Open End Mortgage
Create a Home Valuation Report for This Property
The Home Valuation Report is an in-depth analysis detailing your home's value as well as a comparison with similar homes in the area
Home Values in the Area
Average Home Value in this Area
Purchase History
| Date | Buyer | Sale Price | Title Company |
|---|---|---|---|
| Yoder Owen | $1,635,000 | None Available | |
| Futrell Jimmy B | $410,000 | None Available |
Source: Public Records
Mortgage History
| Date | Status | Borrower | Loan Amount |
|---|---|---|---|
| Open | Yoder Owen | $900,000 | |
| Previous Owner | Futrell Jimmy B | $300,000 |
Source: Public Records
Tax History Compared to Growth
Tax History
| Year | Tax Paid | Tax Assessment Tax Assessment Total Assessment is a certain percentage of the fair market value that is determined by local assessors to be the total taxable value of land and additions on the property. | Land | Improvement |
|---|---|---|---|---|
| 2025 | $1,786 | $242,574 | $0 | $0 |
| 2024 | $1,770 | $242,574 | $0 | $0 |
| 2023 | $1,264 | $242,574 | $62,288 | $180,286 |
| 2022 | $1,264 | $171,249 | $59,667 | $111,582 |
| 2021 | $1,250 | $171,249 | $59,667 | $111,582 |
| 2020 | $1,250 | $171,249 | $59,667 | $111,582 |
| 2019 | $1,276 | $171,249 | $59,667 | $111,582 |
| 2018 | $1,276 | $171,249 | $59,667 | $111,582 |
| 2017 | $1,250 | $171,249 | $59,667 | $111,582 |
| 2016 | $1,393 | $191,785 | $59,046 | $132,739 |
| 2015 | $1,362 | $191,785 | $59,046 | $132,739 |
| 2014 | $1,362 | $191,785 | $59,046 | $132,739 |
| 2013 | $1,398 | $191,785 | $59,046 | $132,739 |
Source: Public Records
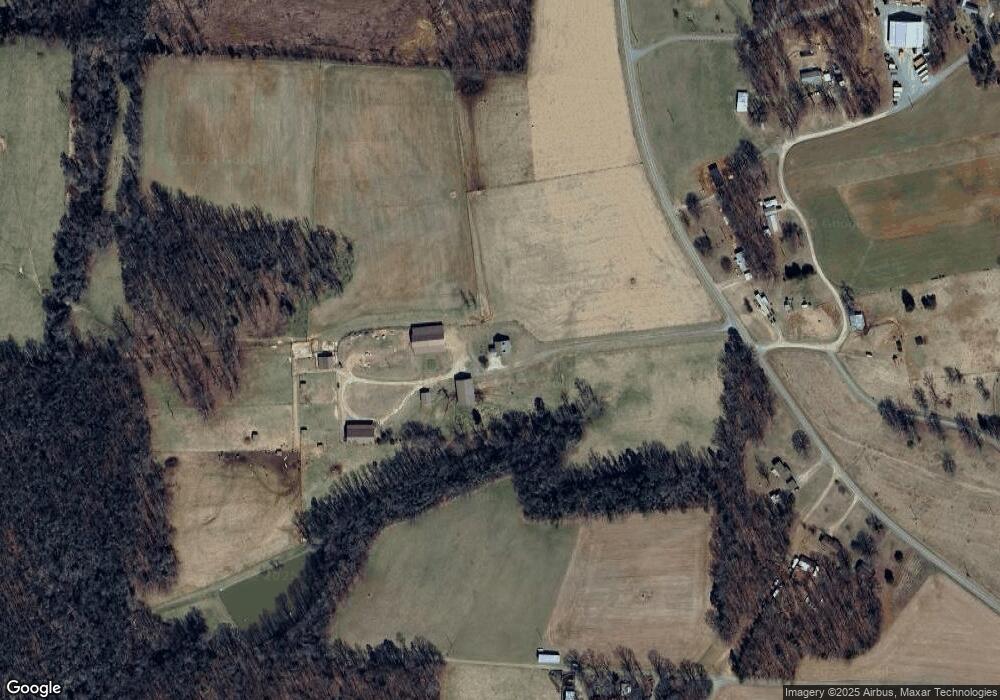
Map
Nearby Homes
- 2531 Howards Bridge Rd
- 00 Somers Rd
- 01 Windsor Rd
- 320 Howards Bridge Rd
- 2084 W Memorial Hwy
- 4508 Deacons Hill Rd
- 4508 Rd
- 7117 Mayberry Mill Rd
- 3460 Jennings Rd
- 153 Badenyon Place
- 2190 W Memorial Hwy
- 2712 Sloan's Mill Rd
- 01 Lydall Westex Rd
- 2533 Sloans Mill Rd
- 499 Indian Hill Rd
- 7422 Wilkes Yadkin Rd
- 875 Eagle Mills Rd
- 675 Ridgeline Rd
- 2766 Rocky Branch Rd
- 1100 Glen Oaks Dr
- 463 Mullis Rd
- 3021 Mullis Rd
- 2616 Howards Bridge Rd
- 3049 Mullis Rd
- 2624 Howards Bridge Rd
- 2624 Howards Bridge Rd
- 3008 Mullis Rd
- 3070 Mullis Rd
- 2401 Howards Bridge Rd
- 5663 Windsor Rd
- 2727 Howards Bridge Rd
- 5809 Windsor Rd
- 5817 Windsor Rd
- 2312 Howards Bridge Rd
- 2305 Howards Bridge Rd
- 5916 Windsor Rd
- 5813 Shiloh Church Rd
- 2349 Old Ben Bow Rd
- 5917 Windsor Rd
- 5503 Saint Pauls Church Rd