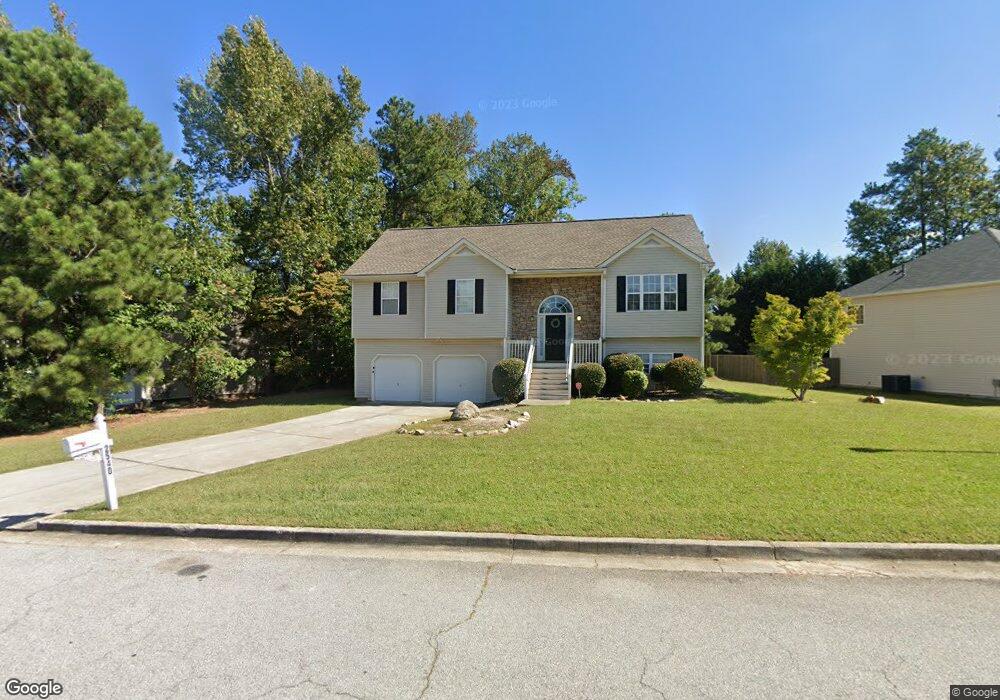
2540 Lithia Ridge Dr Lithia Springs, GA 30122
Lithia Springs NeighborhoodEstimated Value: $299,425 - $342,000
4
Beds
1
Bath
2,227
Sq Ft
$146/Sq Ft
Est. Value
About This Home
This home is located at 2540 Lithia Ridge Dr, Lithia Springs, GA 30122 and is currently estimated at $324,606, approximately $145 per square foot. 2540 Lithia Ridge Dr is a home located in Douglas County with nearby schools including Lithia Springs Elementary School, Turner Middle School, and Lithia Springs Comprehensive High School.
Ownership History
Date
Name
Owned For
Owner Type
Purchase Details
Closed on
May 28, 2025
Sold by
Alto Asset Company 1 Llc
Bought by
Alto Asset Company 3 Llc
Current Estimated Value
Purchase Details
Closed on
Nov 25, 2019
Sold by
Mupr 3 Assets Llc
Bought by
Alto Asset Co 1 Llc
Purchase Details
Closed on
Jul 16, 2019
Sold by
Hardwick Surlenda
Bought by
Mupr 3 Assets Llc
Purchase Details
Closed on
Aug 15, 2008
Sold by
Yorkman-Harper Daniel T
Bought by
Hardwick Surlenda
Purchase Details
Closed on
Oct 12, 2004
Sold by
Kensington Hm Bldrs Inc
Bought by
Yorkman-Harper Daniel T
Home Financials for this Owner
Home Financials are based on the most recent Mortgage that was taken out on this home.
Original Mortgage
$166,648
Interest Rate
5.73%
Mortgage Type
VA
Purchase Details
Closed on
Oct 16, 2003
Sold by
United Marble Inc
Bought by
Legacy Residential Properties
Home Financials for this Owner
Home Financials are based on the most recent Mortgage that was taken out on this home.
Original Mortgage
$116,800
Interest Rate
5.82%
Create a Home Valuation Report for This Property
The Home Valuation Report is an in-depth analysis detailing your home's value as well as a comparison with similar homes in the area
Home Values in the Area
Average Home Value in this Area
Purchase History
| Date | Buyer | Sale Price | Title Company |
|---|---|---|---|
| Alto Asset Company 3 Llc | $1,657,100 | None Listed On Document | |
| Alto Asset Company 3 Llc | $1,657,100 | None Listed On Document | |
| Alto Asset Co 1 Llc | $830,901 | -- | |
| Mupr 3 Assets Llc | $165,000 | -- | |
| Hardwick Surlenda | $158,800 | -- | |
| Yorkman-Harper Daniel T | $168,000 | -- | |
| Legacy Residential Properties | -- | -- |
Source: Public Records
Mortgage History
| Date | Status | Borrower | Loan Amount |
|---|---|---|---|
| Previous Owner | Yorkman-Harper Daniel T | $166,648 | |
| Previous Owner | Legacy Residential Properties | $116,800 |
Source: Public Records
Tax History Compared to Growth
Tax History
| Year | Tax Paid | Tax Assessment Tax Assessment Total Assessment is a certain percentage of the fair market value that is determined by local assessors to be the total taxable value of land and additions on the property. | Land | Improvement |
|---|---|---|---|---|
| 2024 | $3,230 | $100,600 | $22,000 | $78,600 |
| 2023 | $3,230 | $100,600 | $22,000 | $78,600 |
| 2022 | $3,341 | $100,600 | $22,000 | $78,600 |
| 2021 | $2,247 | $78,720 | $11,960 | $66,760 |
| 2020 | $2,667 | $78,720 | $11,960 | $66,760 |
| 2019 | $1,320 | $76,040 | $11,960 | $64,080 |
| 2018 | $2,042 | $72,200 | $11,960 | $60,240 |
| 2017 | $1,922 | $64,960 | $11,960 | $53,000 |
| 2016 | $1,854 | $60,360 | $11,480 | $48,880 |
| 2015 | $1,098 | $36,840 | $7,280 | $29,560 |
| 2014 | $1,098 | $34,360 | $7,280 | $27,080 |
| 2013 | -- | $34,360 | $7,280 | $27,080 |
Source: Public Records
Map
Nearby Homes
- 0 Vulcan Dr Unit 10471332
- 0 Vulcan Dr Unit 7530603
- 7315 Lee Rd
- 3403 Linda Dr
- 0 W Lake Vulcan Dr Unit 10587241
- 7104 Miller St
- 2741 Groovers Lake Point
- 2683 Jordan Ln
- 2694 Jordan Ln
- 2694 Jordan Ln Unit 23
- 2623 Jordan Ln
- 2693 Jordan Ln
- Bradley Plan at The View at Groover's Lake - Georgian Series
- Wisteria Plan at The View at Groover's Lake - Georgian Series
- Bayberry Plan at The View at Groover's Lake - Georgian Series
- Redbud Plan at The View at Groover's Lake - Georgian Series
- 3245 W Anderson Dr
- 3340 Skyview Dr
- 6069 Wisteria Ln
- 3138 Beechwood Dr
- 2540 Lithia Ridge Dr
- 2540 Lithia Ridge Dr Unit 27
- 2550 Lithia Ridge Dr
- 2530 Lithia Ridge Dr
- 2570 Lithia Ridge Dr
- 0 Moonstone Ct
- 1041 Topaz Ln
- 1051 Topaz Ln
- 2545 Lithia Ridge Dr
- 2535 Lithia Ridge Dr
- 1031 Topaz Ln
- 1061 Topaz Ln
- 2551 Citrine Cross
- 2555 Lithia Ridge Dr
- 2541 Citrine Cross
- 2561 Citrine Cross
- 2531 Citrine Cross
- 1044 Moonstone Ct
- 1043 Moonstone Ct