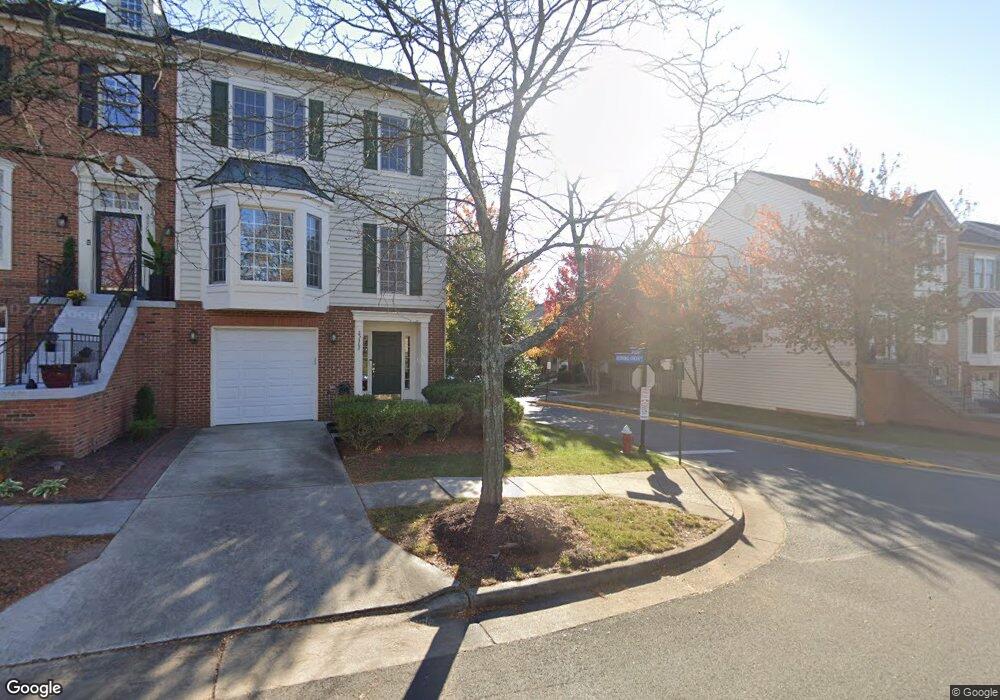
25407 Morse Dr Chantilly, VA 20152
Estimated Value: $485,750 - $607,000
3
Beds
3
Baths
1,376
Sq Ft
$404/Sq Ft
Est. Value
About This Home
This home is located at 25407 Morse Dr, Chantilly, VA 20152 and is currently estimated at $555,438, approximately $403 per square foot. 25407 Morse Dr is a home located in Loudoun County with nearby schools including Hutchison Farm Elementary School, J. Michael Lunsford Middle School, and Freedom High School.
Ownership History
Date
Name
Owned For
Owner Type
Purchase Details
Closed on
Jul 27, 2001
Sold by
Hoffman Justin A
Bought by
Field John Douglas
Current Estimated Value
Home Financials for this Owner
Home Financials are based on the most recent Mortgage that was taken out on this home.
Original Mortgage
$159,910
Outstanding Balance
$62,514
Interest Rate
7.18%
Estimated Equity
$492,924
Purchase Details
Closed on
Sep 5, 1995
Sold by
Nvr Homes Inc
Bought by
Mains John P
Home Financials for this Owner
Home Financials are based on the most recent Mortgage that was taken out on this home.
Original Mortgage
$146,100
Interest Rate
7.61%
Create a Home Valuation Report for This Property
The Home Valuation Report is an in-depth analysis detailing your home's value as well as a comparison with similar homes in the area
Home Values in the Area
Average Home Value in this Area
Purchase History
| Date | Buyer | Sale Price | Title Company |
|---|---|---|---|
| Field John Douglas | $199,900 | -- | |
| Mains John P | $148,090 | -- |
Source: Public Records
Mortgage History
| Date | Status | Borrower | Loan Amount |
|---|---|---|---|
| Open | Field John Douglas | $159,910 | |
| Previous Owner | Mains John P | $146,100 |
Source: Public Records
Tax History Compared to Growth
Tax History
| Year | Tax Paid | Tax Assessment Tax Assessment Total Assessment is a certain percentage of the fair market value that is determined by local assessors to be the total taxable value of land and additions on the property. | Land | Improvement |
|---|---|---|---|---|
| 2025 | $4,289 | $532,760 | $200,000 | $332,760 |
| 2024 | $4,396 | $508,230 | $190,000 | $318,230 |
| 2023 | $4,199 | $479,900 | $190,000 | $289,900 |
| 2022 | $4,021 | $451,760 | $170,000 | $281,760 |
| 2021 | $3,909 | $398,870 | $130,000 | $268,870 |
| 2020 | $3,762 | $363,510 | $130,000 | $233,510 |
| 2019 | $3,654 | $349,640 | $130,000 | $219,640 |
| 2018 | $3,742 | $344,900 | $115,000 | $229,900 |
| 2017 | $3,706 | $329,460 | $115,000 | $214,460 |
| 2016 | $3,683 | $321,670 | $0 | $0 |
| 2015 | $3,548 | $197,560 | $0 | $197,560 |
| 2014 | $3,548 | $192,210 | $0 | $192,210 |
Source: Public Records
Map
Nearby Homes
- 25368 Herring Creek Dr
- 25415 Morse Dr
- 43134 Watercrest Square Unit 200
- 25280 Lake Shore Square Unit 205
- 43005 Beachall St
- 25541 Gwynneth Square
- 25449 Brickell Dr
- 42893 Golf View Dr
- 25336 Ashbury Dr
- 25328 Ashbury Dr
- 25670 S Village Dr
- 43437 Town Gate Square
- 43387 Town Gate Square
- 25304 Whippoorwill Terrace
- 43368 Town Gate Square
- 43613 Helmsdale Terrace
- 25298 Shipley Terrace
- 25304 Shipley Terrace
- 42835 Shaler St
- 43140 Town Hall Plaza
- 25405 Morse Dr
- 25409 Morse Dr
- 25411 Morse Dr
- 25403 Morse Dr
- 25413 Morse Dr
- 25401 Morse Dr
- 43180 Moshupe Way
- 25419 Morse Dr
- 25370 Herring Creek Dr
- 43182 Moshupe Way
- 25362 Herring Creek Dr
- 25374 Herring Creek Dr
- 25421 Morse Dr
- 25400 Herring Creek Dr
- 25402 Herring Creek Dr
- 25398 Herring Creek Dr
- 43184 Moshupe Way
- 25406 Herring Creek Dr
- 25396 Herring Creek Dr
- 25360 Herring Creek Dr