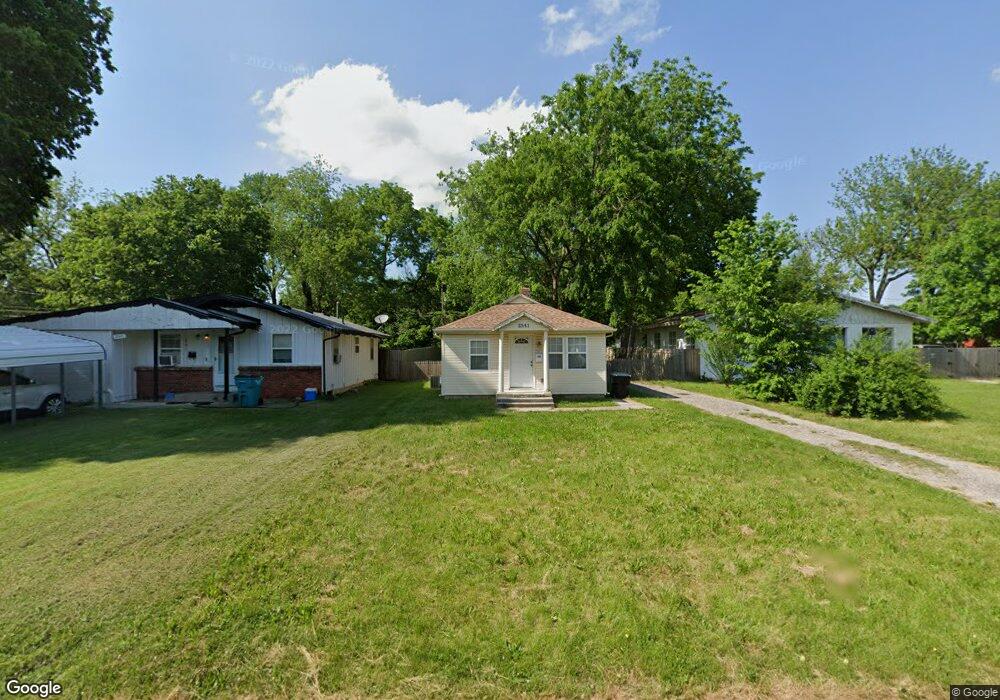
2541 W Monroe St Springfield, MO 65802
Westside NeighborhoodEstimated Value: $76,003 - $120,000
2
Beds
1
Bath
630
Sq Ft
$150/Sq Ft
Est. Value
About This Home
This home is located at 2541 W Monroe St, Springfield, MO 65802 and is currently estimated at $94,501, approximately $150 per square foot. 2541 W Monroe St is a home located in Greene County with nearby schools including Central High School and Phelps Center for Gifted Education.
Ownership History
Date
Name
Owned For
Owner Type
Purchase Details
Closed on
Nov 21, 2008
Sold by
Aldrich Karen A
Bought by
Harriman Dan and Harriman Belinda
Current Estimated Value
Purchase Details
Closed on
Sep 6, 2007
Sold by
Ketel Martha Ann and Miller Martha Ann
Bought by
Aldrich Karen A
Create a Home Valuation Report for This Property
The Home Valuation Report is an in-depth analysis detailing your home's value as well as a comparison with similar homes in the area
Home Values in the Area
Average Home Value in this Area
Purchase History
| Date | Buyer | Sale Price | Title Company |
|---|---|---|---|
| Harriman Dan | -- | None Available | |
| Aldrich Karen A | -- | None Available |
Source: Public Records
Tax History
| Year | Tax Paid | Tax Assessment Tax Assessment Total Assessment is a certain percentage of the fair market value that is determined by local assessors to be the total taxable value of land and additions on the property. | Land | Improvement |
|---|---|---|---|---|
| 2025 | $425 | $8,530 | $3,800 | $4,730 |
| 2024 | $344 | $6,420 | $2,280 | $4,140 |
| 2023 | $342 | $6,420 | $2,280 | $4,140 |
| 2022 | $348 | $6,370 | $2,280 | $4,090 |
| 2021 | $348 | $6,370 | $2,280 | $4,090 |
| 2020 | $357 | $6,250 | $2,280 | $3,970 |
| 2019 | $347 | $6,250 | $2,280 | $3,970 |
| 2018 | $342 | $6,160 | $1,900 | $4,260 |
| 2017 | $338 | $6,380 | $1,900 | $4,480 |
| 2016 | $350 | $6,380 | $1,900 | $4,480 |
| 2015 | $346 | $6,380 | $1,900 | $4,480 |
| 2014 | $349 | $6,380 | $1,900 | $4,480 |
Source: Public Records
Map
Nearby Homes
- 2527 W Lombard St
- 641 S Warren Ave
- 545 S Forest Ct
- 2516 W Elm St
- 541 S Warren Ave
- 2643 W Walnut St
- 629 S Glenn Ave
- 2323 W Walnut St
- 2727 W Walnut St
- 2903 W Lombard St
- 2831 W Elm St
- 2041 W Elm St
- 2322 W Olive St
- 2423 W Olive St
- 2025 W Walnut St
- 3020 W Elm St
- 1808 W Walnut St
- 2946 W Olive St
- 2634 W Phelps St
- 3156 W Mount Vernon St
- 2545 W Monroe St
- 2551 W Monroe St
- 2529 W Monroe St
- 2557 W Monroe St
- 2540 W State St
- 2534 W State St
- 2544 W State St
- 2530 W State St
- 2550 W State St
- 2540 W Monroe St
- 2526 W State St
- 2534 W Monroe St
- 2556 W State St
- 2556 W Monroe St
- 2528 W Monroe St
- 2550 W Monroe St
- 2526 W Monroe St
- 2516 W State St
- 717 S Clifton Ave
- 2520 W Monroe St
Your Personal Tour Guide
Ask me questions while you tour the home.