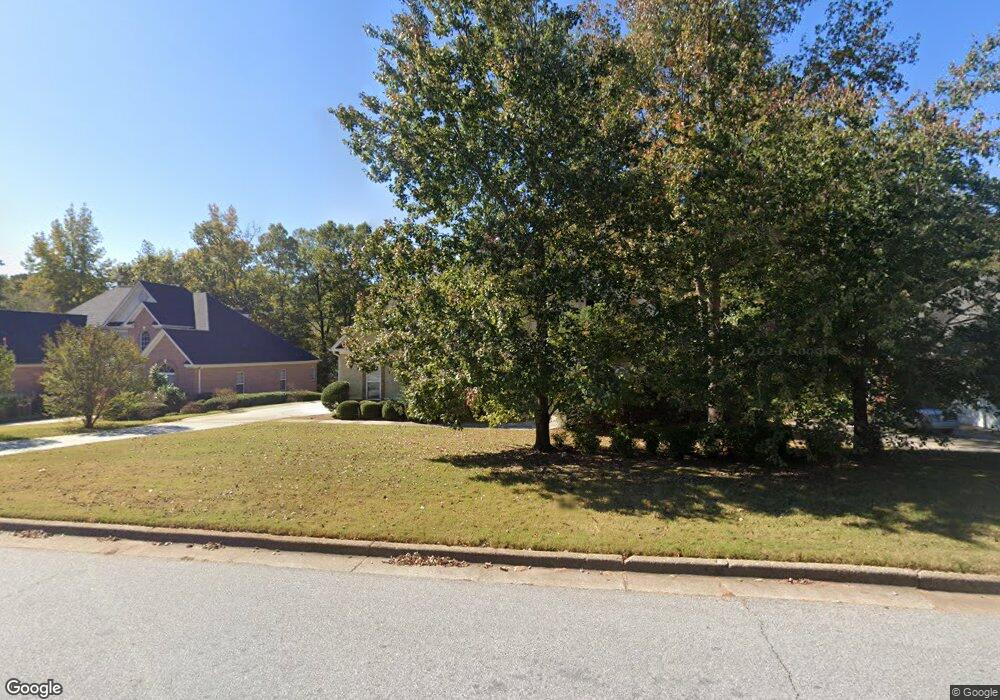
2541 Weatherstone Cir SE Conyers, GA 30094
Estimated Value: $381,147 - $462,000
4
Beds
2
Baths
2,829
Sq Ft
$148/Sq Ft
Est. Value
About This Home
This home is located at 2541 Weatherstone Cir SE, Conyers, GA 30094 and is currently estimated at $418,787, approximately $148 per square foot. 2541 Weatherstone Cir SE is a home located in Rockdale County with nearby schools including Flat Shoals Elementary School, Edwards Middle School, and Rockdale County High School.
Ownership History
Date
Name
Owned For
Owner Type
Purchase Details
Closed on
Oct 5, 2006
Sold by
Phh Mtg
Bought by
Warren Martkia S
Current Estimated Value
Home Financials for this Owner
Home Financials are based on the most recent Mortgage that was taken out on this home.
Original Mortgage
$49,000
Outstanding Balance
$29,223
Interest Rate
6.45%
Mortgage Type
New Conventional
Estimated Equity
$389,564
Purchase Details
Closed on
Mar 7, 2006
Sold by
Jones Miko A
Bought by
Phh Mtg Corp
Purchase Details
Closed on
Sep 12, 2003
Sold by
Castle Grp Hms Inc
Bought by
Jones Miko A
Home Financials for this Owner
Home Financials are based on the most recent Mortgage that was taken out on this home.
Original Mortgage
$236,000
Interest Rate
3.13%
Mortgage Type
New Conventional
Create a Home Valuation Report for This Property
The Home Valuation Report is an in-depth analysis detailing your home's value as well as a comparison with similar homes in the area
Home Values in the Area
Average Home Value in this Area
Purchase History
| Date | Buyer | Sale Price | Title Company |
|---|---|---|---|
| Warren Martkia S | $245,000 | -- | |
| Warren Martika S | $245,000 | -- | |
| Phh Mtg Corp | $225,810 | -- | |
| Jones Miko A | $148,500 | -- |
Source: Public Records
Mortgage History
| Date | Status | Borrower | Loan Amount |
|---|---|---|---|
| Open | Warren Martika S | $49,000 | |
| Previous Owner | Jones Miko A | $236,000 |
Source: Public Records
Tax History Compared to Growth
Tax History
| Year | Tax Paid | Tax Assessment Tax Assessment Total Assessment is a certain percentage of the fair market value that is determined by local assessors to be the total taxable value of land and additions on the property. | Land | Improvement |
|---|---|---|---|---|
| 2024 | $4,551 | $180,920 | $30,920 | $150,000 |
| 2023 | $3,989 | $164,880 | $30,800 | $134,080 |
| 2022 | $3,239 | $135,640 | $24,960 | $110,680 |
| 2021 | $2,872 | $113,920 | $20,800 | $93,120 |
| 2020 | $2,588 | $100,320 | $17,760 | $82,560 |
| 2019 | $2,438 | $93,360 | $10,800 | $82,560 |
| 2018 | $2,159 | $83,840 | $10,800 | $73,040 |
| 2017 | $1,948 | $76,200 | $10,800 | $65,400 |
| 2016 | $1,799 | $76,200 | $10,800 | $65,400 |
| 2015 | $1,539 | $67,080 | $9,320 | $57,760 |
| 2014 | $1,181 | $59,480 | $8,000 | $51,480 |
| 2013 | -- | $96,440 | $13,600 | $82,840 |
Source: Public Records
Map
Nearby Homes
- 340 Windsor Walk SE
- 1420 Hillside Place SE
- 2631 Rolling Hills Way SE
- 1601 Creek Crossing SE
- 309 Windsor Walk SE Unit 1
- Boston Plan at Millers Pointe
- Atlanta Plan at Millers Pointe
- Columbus Plan at Millers Pointe
- 2464 Lennox Rd SE
- 1508 Hillside Dr SE
- 2537 Lennox Rd SE
- 2608 Downing Park Dr SE
- 1511 Hillside Dr SE
- 2617 Laurel Woods Ln SE Unit 3
- 784 Stieff Ct SE
- 2717 Stanton Woods Dr SE
- 2370 Ebenezer Rd SE
- 250 Smile Dr SE
- 2197 Boxwood Cir
- 574 Almand Branch Rd SE Unit 1
- 2531 Weatherstone Cir SE
- 2551 Weatherstone Cir SE Unit 7
- 2521 Weatherstone Cir SE Unit 7
- 2561 Weatherstone Cir SE Unit 7
- 2530 Weatherstone Cir SE Unit 7
- 2540 Weatherstone Cir SE Unit 7
- 1600 Pin Oak Ln SE
- 1600 Pin Oak Ln SE Unit 1600
- 2520 Weatherstone Cir SE Unit 7
- 2511 Weatherstone Cir SE
- 2550 Weatherstone Cir SE Unit 7
- 2571 Weatherstone Cir SE
- 2510 Weatherstone Cir SE Unit 7
- 1591 Pin Oak Ln SE
- 2501 Weatherstone Cir SE
- 2581 Weatherstone Cir SE
- 2490 Weatherstone Cir SE
- 2331 Weldon Rd SE
- 1590 Pin Oak Ln SE
- 2591 Weatherstone Cir SE