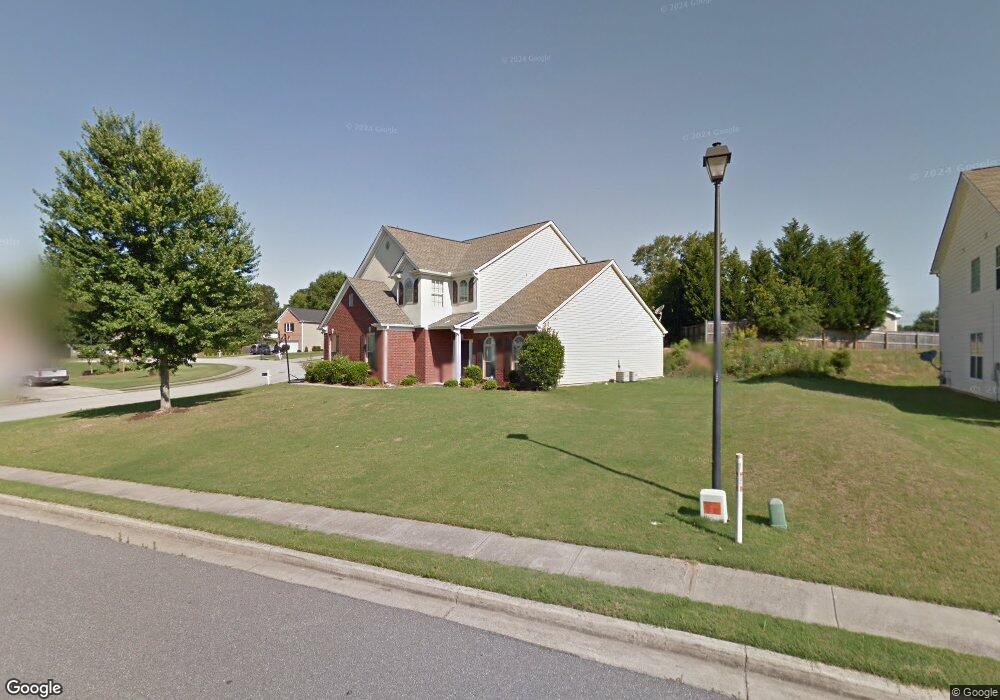
2542 Dunleigh Place Buford, GA 30519
Estimated Value: $413,000 - $438,000
4
Beds
3
Baths
2,515
Sq Ft
$170/Sq Ft
Est. Value
About This Home
This home is located at 2542 Dunleigh Place, Buford, GA 30519 and is currently estimated at $426,921, approximately $169 per square foot. 2542 Dunleigh Place is a home located in Gwinnett County with nearby schools including Freeman's Mill Elementary School, Twin Rivers Middle School, and Mountain View High School.
Ownership History
Date
Name
Owned For
Owner Type
Purchase Details
Closed on
Nov 21, 2023
Sold by
Mcknight Andrea T Osborne
Bought by
Osborne Andrea T
Current Estimated Value
Purchase Details
Closed on
Oct 28, 2010
Sold by
Mcknight Joseph
Bought by
Osborne-Mcknight Andrea T
Purchase Details
Closed on
Jun 27, 2002
Sold by
Cherry Darlene N
Bought by
Osborne-Bullock Vera E
Home Financials for this Owner
Home Financials are based on the most recent Mortgage that was taken out on this home.
Original Mortgage
$150,100
Interest Rate
6.87%
Mortgage Type
New Conventional
Purchase Details
Closed on
Mar 30, 1999
Sold by
Moore Chet W
Bought by
Cherry Darlene N
Home Financials for this Owner
Home Financials are based on the most recent Mortgage that was taken out on this home.
Original Mortgage
$89,000
Interest Rate
6.85%
Mortgage Type
New Conventional
Create a Home Valuation Report for This Property
The Home Valuation Report is an in-depth analysis detailing your home's value as well as a comparison with similar homes in the area
Home Values in the Area
Average Home Value in this Area
Purchase History
| Date | Buyer | Sale Price | Title Company |
|---|---|---|---|
| Osborne Andrea T | -- | -- | |
| Osborne-Mcknight Andrea T | -- | -- | |
| Osborne-Bullock Vera E | $158,000 | -- | |
| Cherry Darlene N | $149,000 | -- |
Source: Public Records
Mortgage History
| Date | Status | Borrower | Loan Amount |
|---|---|---|---|
| Previous Owner | Osborne-Bullock Vera E | $150,100 | |
| Previous Owner | Cherry Darlene N | $89,000 |
Source: Public Records
Tax History Compared to Growth
Tax History
| Year | Tax Paid | Tax Assessment Tax Assessment Total Assessment is a certain percentage of the fair market value that is determined by local assessors to be the total taxable value of land and additions on the property. | Land | Improvement |
|---|---|---|---|---|
| 2025 | $5,077 | $168,440 | $26,000 | $142,440 |
| 2024 | $5,289 | $172,040 | $30,000 | $142,040 |
| 2023 | $5,289 | $175,400 | $30,000 | $145,400 |
| 2022 | $4,778 | $149,040 | $26,000 | $123,040 |
| 2021 | $4,047 | $111,080 | $19,200 | $91,880 |
| 2020 | $3,825 | $102,040 | $16,000 | $86,040 |
| 2019 | $3,689 | $102,040 | $16,000 | $86,040 |
| 2018 | $3,191 | $87,720 | $16,000 | $71,720 |
| 2016 | $2,785 | $75,560 | $12,800 | $62,760 |
| 2015 | $2,577 | $68,920 | $10,800 | $58,120 |
| 2014 | $2,590 | $68,920 | $10,800 | $58,120 |
Source: Public Records
Map
Nearby Homes
- 2299 Misty Ivy Ct
- 2500 Morgan Chase Dr
- 2402 Bancroft Way
- 2508 Morgan Chase Dr
- 2256 Hansford Pass
- 2253 Hansford Pass
- 2729 Morgan Glen Rd
- 2233 Hansford Pass
- 2557 Woodford Ln
- 2147 Saint Albans Place
- 2238 Saint Albans Place
- 2228 Lakeview Bend Way
- 2144 Beacon Crest Dr
- 2375 Matlin Way
- 2365 Valley Mill Dr Unit 1
- 2655 Camp Branch Rd
- 2507 Gristhaven Ln
- 0 Dunleigh Place Unit 7532246
- 0 Dunleigh Place Unit 7258279
- 0 Dunleigh Place Unit 8727471
- 0 Dunleigh Place Unit 8535640
- 0 Dunleigh Place Unit 7187972
- 0 Dunleigh Place Unit 7030327
- 2560 Kirkstone Dr
- 2532 Dunleigh Place
- 2543 Dunleigh Place Unit 1
- 2570 Kirkstone Dr Unit 1
- 2522 Dunleigh Place
- 2358 Gravel Springs Rd
- 2530 Kirkstone Dr
- 2580 Kirkstone Dr
- 2553 Dunleigh Place
- 2512 Dunleigh Place
- 2583 Dunleigh Place
- 2573 Dunleigh Place
- 2563 Dunleigh Place
- 2590 Kirkstone Dr