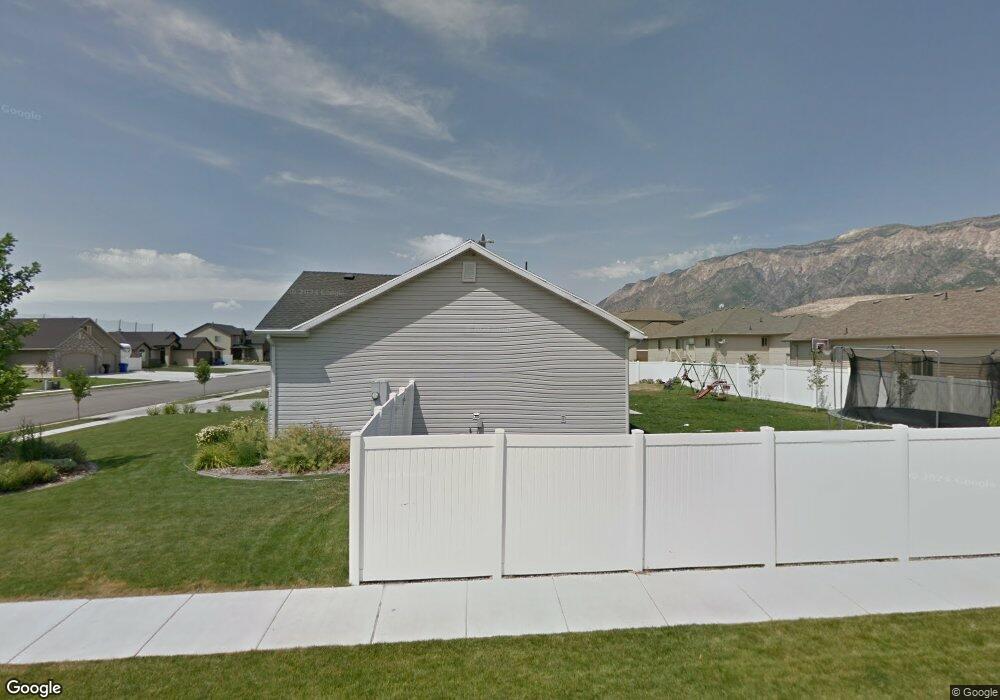
2542 W 3500 N Farr West, UT 84404
Estimated Value: $507,697 - $618,000
5
Beds
2
Baths
1,118
Sq Ft
$496/Sq Ft
Est. Value
About This Home
This home is located at 2542 W 3500 N, Farr West, UT 84404 and is currently estimated at $554,424, approximately $495 per square foot. 2542 W 3500 N is a home located in Weber County with nearby schools including Wahlquist Junior High School and Fremont High School.
Ownership History
Date
Name
Owned For
Owner Type
Purchase Details
Closed on
Apr 15, 2009
Sold by
Larsen Eric S and Larsen Amy B
Bought by
Hansen Zachary and Hansen Marci
Current Estimated Value
Home Financials for this Owner
Home Financials are based on the most recent Mortgage that was taken out on this home.
Original Mortgage
$191,468
Outstanding Balance
$122,526
Interest Rate
5.17%
Mortgage Type
FHA
Estimated Equity
$431,898
Purchase Details
Closed on
May 25, 2005
Sold by
Aland James
Bought by
Great American Homes Inc
Home Financials for this Owner
Home Financials are based on the most recent Mortgage that was taken out on this home.
Original Mortgage
$39,200
Interest Rate
5.74%
Mortgage Type
Purchase Money Mortgage
Create a Home Valuation Report for This Property
The Home Valuation Report is an in-depth analysis detailing your home's value as well as a comparison with similar homes in the area
Home Values in the Area
Average Home Value in this Area
Purchase History
| Date | Buyer | Sale Price | Title Company |
|---|---|---|---|
| Hansen Zachary | -- | American Dream Title Ins Age | |
| Great American Homes Inc | -- | Mountain View Title Ogden |
Source: Public Records
Mortgage History
| Date | Status | Borrower | Loan Amount |
|---|---|---|---|
| Open | Hansen Zachary | $191,468 | |
| Previous Owner | Great American Homes Inc | $39,200 |
Source: Public Records
Tax History Compared to Growth
Tax History
| Year | Tax Paid | Tax Assessment Tax Assessment Total Assessment is a certain percentage of the fair market value that is determined by local assessors to be the total taxable value of land and additions on the property. | Land | Improvement |
|---|---|---|---|---|
| 2025 | $3,177 | $493,373 | $191,078 | $302,295 |
| 2024 | $3,089 | $486,000 | $191,078 | $294,922 |
| 2023 | $3,002 | $471,000 | $190,546 | $280,454 |
| 2022 | $3,128 | $509,000 | $172,636 | $336,364 |
| 2021 | $2,555 | $378,000 | $108,851 | $269,149 |
| 2020 | $2,382 | $321,000 | $108,851 | $212,149 |
| 2019 | $2,283 | $289,000 | $90,006 | $198,994 |
| 2018 | $2,145 | $258,000 | $75,473 | $182,527 |
| 2017 | $2,050 | $238,000 | $73,731 | $164,269 |
| 2016 | $1,891 | $117,708 | $42,726 | $74,982 |
| 2015 | $1,527 | $89,970 | $31,756 | $58,214 |
| 2014 | $1,450 | $82,377 | $31,756 | $50,621 |
Source: Public Records
Map
Nearby Homes
- 3533 Remuda Dr
- 1158 3425 N Unit 212
- 3274 2500 W
- 3261 2500 W
- 3268 2425 W
- 3059 N 2825 W
- 2405 W 3200 N
- 3356 N 2900 W
- 2417 W 3200 N
- 2830 W North Plain City Rd
- 3524 N 3000 W
- 2878 W North Plain City Rd
- 2508 W 3000 N
- 2452 W 3000 N
- 3202 N 2875 W Unit 39
- 3221 N 2875 W Unit 33
- 3190 N 2875 W Unit 38
- 3209 N 2875 W Unit 34
- Aberdeen Plan at Hart Estates - Farr West
- Glendale Plan at Hart Estates - Farr West
- 3506 N 2550 W
- 3512 N 2550 W
- 3512 N 2550 W Unit 448
- 3515 N 2500 W
- 3520 N 2550 W
- 2535 W 3500 N
- 2535 W 3500 N Unit 415
- 3519 N 2500 W
- 2558 W 3500 N
- 3495 N 2500 W
- 2553 W 3500 N
- 2553 W 3500 N Unit 416
- 3515 N 2550 W
- 3510 N 2500 W
- 3528 N 2550 W
- 2561 W 3500 N
- 3502 N 2500 W
- 3502 N 2500 W Unit 362
- 3529 N 2500 W
- 3523 N 2550 W