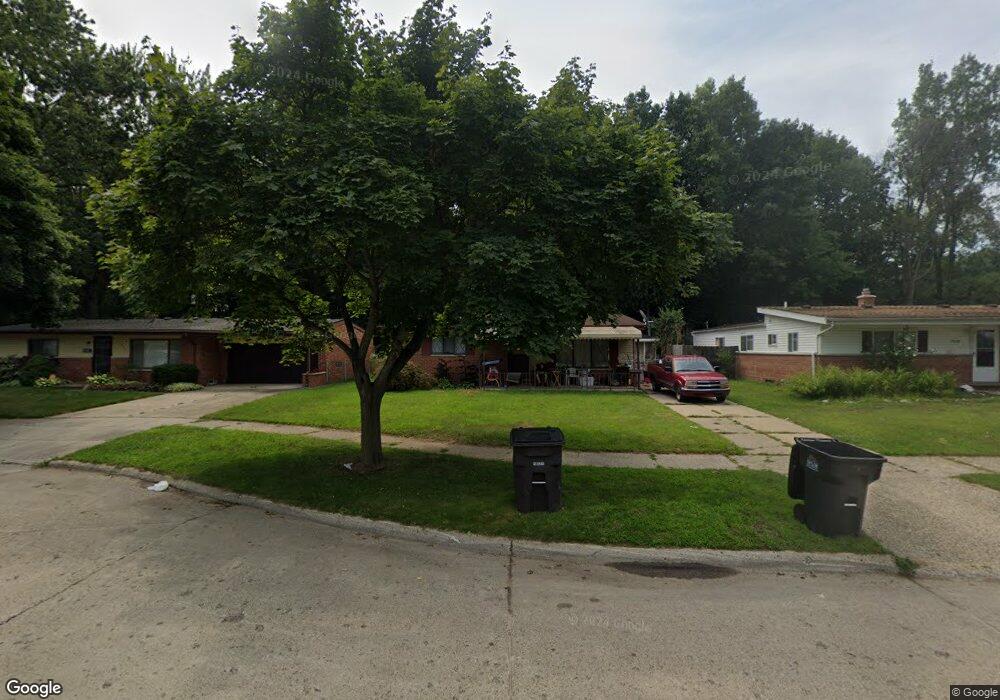
25427 Haskell St Taylor, MI 48180
Estimated Value: $187,000 - $208,000
3
Beds
1
Bath
1,230
Sq Ft
$161/Sq Ft
Est. Value
About This Home
This home is located at 25427 Haskell St, Taylor, MI 48180 and is currently estimated at $198,209, approximately $161 per square foot. 25427 Haskell St is a home located in Wayne County with nearby schools including Taylor Parks Elementary School, Hoover Middle School, and Taylor High School.
Ownership History
Date
Name
Owned For
Owner Type
Purchase Details
Closed on
Jan 28, 2010
Sold by
Katies Properties
Bought by
Kates Properties
Current Estimated Value
Purchase Details
Closed on
Nov 16, 2009
Sold by
Donovan Shaun and Secretary Of Housing & Urban D
Bought by
Katies Properties
Purchase Details
Closed on
Sep 29, 2008
Sold by
Wells Fargo Bank Na
Bought by
The Secretary Of Housing & Urban Develop
Purchase Details
Closed on
Mar 26, 2008
Sold by
Orvis Norman Eugene and Bozich Sandra A
Bought by
Wells Fargo Bank Na
Purchase Details
Closed on
Oct 22, 2003
Sold by
Orvis Norman Eugene
Bought by
Orvis Norman Eugene
Home Financials for this Owner
Home Financials are based on the most recent Mortgage that was taken out on this home.
Original Mortgage
$113,857
Interest Rate
6.03%
Mortgage Type
New Conventional
Purchase Details
Closed on
Dec 20, 2000
Sold by
Goudreau Dina M
Bought by
Orvis Norman E
Create a Home Valuation Report for This Property
The Home Valuation Report is an in-depth analysis detailing your home's value as well as a comparison with similar homes in the area
Home Values in the Area
Average Home Value in this Area
Purchase History
| Date | Buyer | Sale Price | Title Company |
|---|---|---|---|
| Kates Properties | -- | None Available | |
| Katies Properties | $31,250 | None Available | |
| The Secretary Of Housing & Urban Develop | -- | None Available | |
| Wells Fargo Bank Na | $115,886 | None Available | |
| Orvis Norman Eugene | -- | First Michigan Title Inc | |
| Orvis Norman E | $110,000 | -- |
Source: Public Records
Mortgage History
| Date | Status | Borrower | Loan Amount |
|---|---|---|---|
| Previous Owner | Orvis Norman Eugene | $113,857 |
Source: Public Records
Tax History
| Year | Tax Paid | Tax Assessment Tax Assessment Total Assessment is a certain percentage of the fair market value that is determined by local assessors to be the total taxable value of land and additions on the property. | Land | Improvement |
|---|---|---|---|---|
| 2025 | $2,508 | $91,700 | $0 | $0 |
| 2024 | $2,435 | $84,300 | $0 | $0 |
| 2023 | $2,742 | $72,200 | $0 | $0 |
| 2022 | $2,291 | $69,100 | $0 | $0 |
| 2021 | $2,448 | $64,000 | $0 | $0 |
| 2020 | $2,421 | $55,700 | $0 | $0 |
| 2019 | $240,842 | $48,300 | $0 | $0 |
| 2018 | $2,011 | $37,200 | $0 | $0 |
| 2017 | $776 | $34,300 | $0 | $0 |
| 2016 | $2,334 | $33,300 | $0 | $0 |
| 2015 | $3,190 | $33,600 | $0 | $0 |
| 2013 | $3,170 | $32,900 | $0 | $0 |
| 2012 | $2,056 | $32,000 | $11,700 | $20,300 |
Source: Public Records
Map
Nearby Homes
- 8350 Gulley St
- 25615 Wohlfeil St
- 8853 Beech Daly Rd
- 24920 Chernick St
- 7550 Wilkie St
- 26017 Gary St Unit RV093
- 7536 Wilkie St
- 26012 Gary St Unit RV061
- 26170 Wick Rd
- 26020 Gary St Unit RV065
- 26031 Gary St Unit RV100
- 25255 Charles St
- 26034 Gary St Unit RV072
- 26110 Gary St Unit RV076
- 26016 5th St Unit RA196
- 26018 5th St Unit 197
- 26030 Lori St Unit RV014
- 26020 5th St Unit RA198
- 9712 Cherokee St
- 26017 4th St Unit RA175
- 25437 Haskell St
- 25415 Haskell St
- 25449 Haskell St
- 8396 Gulley St
- 25405 Haskell St
- 25446 Haskell St
- 8397 Gulley St
- 8384 Gulley St
- 25460 Haskell St
- 25511 Haskell St
- 8385 Gulley St
- 25504 Haskell St
- 8372 Gulley St
- 25365 Haskell St
- 25377 Haskell St
- 25525 Haskell St
- 25514 Haskell St
- 25445 Filmore St
- 8360 Gulley St
- 25457 Filmore St
Your Personal Tour Guide
Ask me questions while you tour the home.