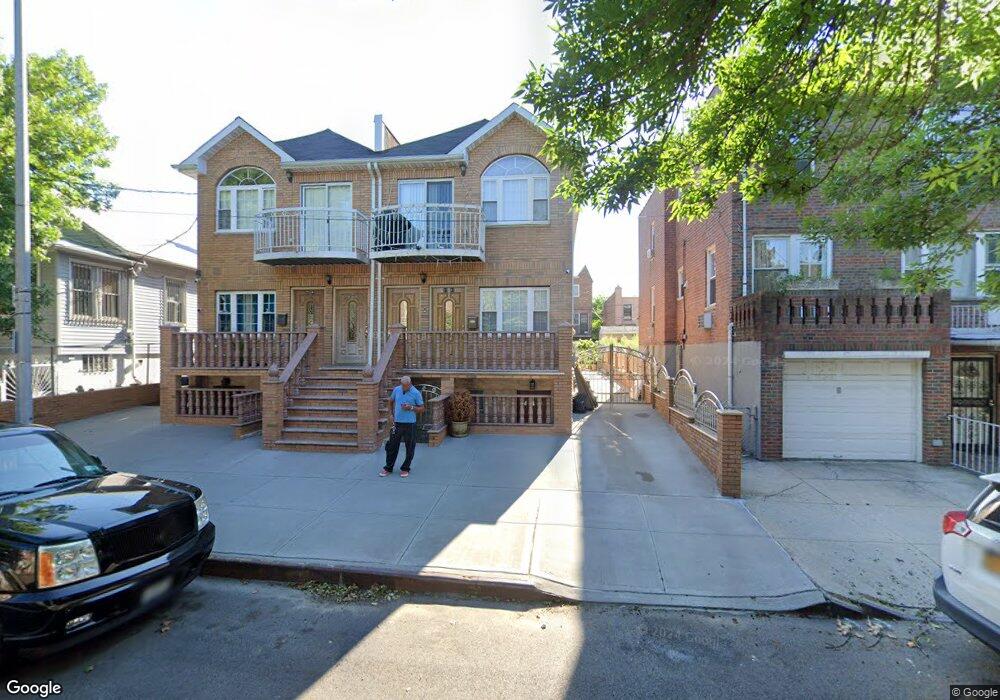
2543 82nd St East Elmhurst, NY 11370
Jackson Heights NeighborhoodEstimated Value: $1,188,062 - $1,340,000
--
Bed
--
Bath
2,040
Sq Ft
$607/Sq Ft
Est. Value
About This Home
This home is located at 2543 82nd St, East Elmhurst, NY 11370 and is currently estimated at $1,239,016, approximately $607 per square foot. 2543 82nd St is a home located in Queens County with nearby schools including P.S. 2 Alfred Zimberg, Is 141 The Steinway, and Newtown High School.
Ownership History
Date
Name
Owned For
Owner Type
Purchase Details
Closed on
May 7, 2008
Sold by
Nafisa Inc
Bought by
Gutic Hajsa and Gutic Sefket
Current Estimated Value
Home Financials for this Owner
Home Financials are based on the most recent Mortgage that was taken out on this home.
Original Mortgage
$644,000
Outstanding Balance
$408,482
Interest Rate
5.91%
Mortgage Type
Purchase Money Mortgage
Estimated Equity
$830,535
Purchase Details
Closed on
Jul 18, 2007
Sold by
Maddula Gall R
Bought by
Nafisa Inc
Purchase Details
Closed on
Feb 14, 2007
Sold by
Estate Of Mary Senchuk and Sophia Baychuk Administrator
Bought by
Maddula Gall R
Home Financials for this Owner
Home Financials are based on the most recent Mortgage that was taken out on this home.
Original Mortgage
$112,500
Interest Rate
6.27%
Create a Home Valuation Report for This Property
The Home Valuation Report is an in-depth analysis detailing your home's value as well as a comparison with similar homes in the area
Home Values in the Area
Average Home Value in this Area
Purchase History
| Date | Buyer | Sale Price | Title Company |
|---|---|---|---|
| Gutic Hajsa | $805,000 | -- | |
| Gutic Hajsa | $805,000 | -- | |
| Nafisa Inc | -- | -- | |
| Nafisa Inc | -- | -- | |
| Maddula Gall R | $750,000 | -- | |
| Maddula Gall R | $750,000 | -- |
Source: Public Records
Mortgage History
| Date | Status | Borrower | Loan Amount |
|---|---|---|---|
| Open | Gutic Hajsa | $644,000 | |
| Closed | Gutic Hajsa | $644,000 | |
| Previous Owner | Maddula Gall R | $112,500 | |
| Previous Owner | Maddula Gall R | $600,000 |
Source: Public Records
Tax History Compared to Growth
Tax History
| Year | Tax Paid | Tax Assessment Tax Assessment Total Assessment is a certain percentage of the fair market value that is determined by local assessors to be the total taxable value of land and additions on the property. | Land | Improvement |
|---|---|---|---|---|
| 2025 | $10,846 | $57,240 | $8,322 | $48,918 |
| 2024 | $10,846 | $54,000 | $8,756 | $45,244 |
| 2023 | $10,593 | $52,740 | $8,305 | $44,435 |
| 2022 | $9,933 | $69,840 | $11,820 | $58,020 |
| 2021 | $10,471 | $74,700 | $11,820 | $62,880 |
| 2020 | $10,097 | $73,860 | $11,820 | $62,040 |
| 2019 | $9,414 | $66,360 | $11,820 | $54,540 |
| 2018 | $8,959 | $43,950 | $9,076 | $34,874 |
| 2017 | $8,452 | $41,463 | $9,701 | $31,762 |
| 2016 | $8,289 | $41,463 | $9,701 | $31,762 |
| 2015 | $4,498 | $39,750 | $11,716 | $28,034 |
| 2014 | $4,498 | $37,500 | $13,140 | $24,360 |
Source: Public Records
Map
Nearby Homes