Estimated Value: $428,000 - $459,000
5
Beds
2
Baths
1,008
Sq Ft
$438/Sq Ft
Est. Value
About This Home
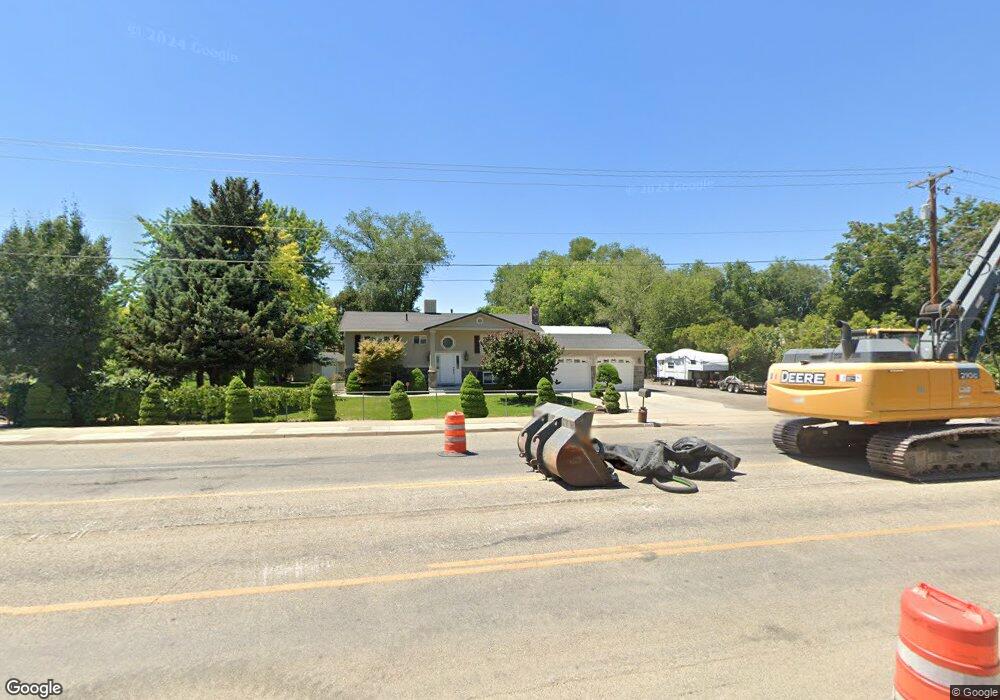
This home is located at 2543 N 2000 W, Ogden, UT 84404 and is currently estimated at $441,259, approximately $437 per square foot. 2543 N 2000 W is a home located in Weber County with nearby schools including Farr West Elementary School, Wahlquist Junior High School, and Fremont High School.
Ownership History
Date
Name
Owned For
Owner Type
Purchase Details
Closed on
Sep 8, 2025
Sold by
Thornock Randy G
Bought by
Thornock Trust and Thornock
Current Estimated Value
Purchase Details
Closed on
Mar 8, 1999
Sold by
Thornock Randy G
Bought by
Thornock Randy G
Home Financials for this Owner
Home Financials are based on the most recent Mortgage that was taken out on this home.
Original Mortgage
$68,500
Interest Rate
6.7%
Purchase Details
Closed on
May 23, 1996
Sold by
Thornock Lisa M
Bought by
Thornock Randy G
Home Financials for this Owner
Home Financials are based on the most recent Mortgage that was taken out on this home.
Original Mortgage
$59,000
Interest Rate
8.07%
Create a Home Valuation Report for This Property
The Home Valuation Report is an in-depth analysis detailing your home's value as well as a comparison with similar homes in the area
Home Values in the Area
Average Home Value in this Area
Purchase History
| Date | Buyer | Sale Price | Title Company |
|---|---|---|---|
| Thornock Trust | -- | None Listed On Document | |
| Thornock Randy G | -- | Associated Title | |
| Thornock Randy G | -- | Mountain View Title |
Source: Public Records
Mortgage History
| Date | Status | Borrower | Loan Amount |
|---|---|---|---|
| Previous Owner | Thornock Randy G | $68,500 | |
| Previous Owner | Thornock Randy G | $59,000 |
Source: Public Records
Tax History
| Year | Tax Paid | Tax Assessment Tax Assessment Total Assessment is a certain percentage of the fair market value that is determined by local assessors to be the total taxable value of land and additions on the property. | Land | Improvement |
|---|---|---|---|---|
| 2025 | $2,519 | $439,597 | $118,270 | $321,327 |
| 2024 | $2,433 | $237,598 | $65,179 | $172,419 |
| 2023 | $2,141 | $206,800 | $65,180 | $141,620 |
| 2022 | $2,150 | $212,300 | $62,872 | $149,428 |
| 2021 | $1,902 | $317,000 | $88,899 | $228,101 |
| 2020 | $1,846 | $282,000 | $46,463 | $235,537 |
| 2019 | $1,844 | $266,000 | $42,283 | $223,717 |
| 2018 | $1,868 | $258,001 | $42,283 | $215,718 |
| 2017 | $1,927 | $258,312 | $41,826 | $216,486 |
| 2016 | $1,730 | $125,260 | $22,992 | $102,268 |
| 2015 | $1,536 | $109,520 | $24,638 | $84,882 |
| 2014 | $1,479 | $102,824 | $29,013 | $73,811 |
Source: Public Records
Map
Nearby Homes
- 2250 N 2000 W
- 2942 N 2000 W
- 1700 W 2700 N Unit 112
- 1700 W 2700 N Unit 110
- 1700 W 2700 N Unit 37
- 1700 W 2700 N Unit 5
- 1700 W 2700 N Unit 110
- 1700 W 2700 N Unit 36
- 1700 W 2700 N Unit 84
- 2017 N 2000 W
- 2442 W 2850 N
- 2409 W 2950 N Unit 101
- 2427 W 2950 N Unit 100
- 2581 W 2825 N
- 3139 N Pelican Dr
- 2452 W 2950 N
- 2452 W 2950 N Unit 112
- 2624 W 2225 N
- 2750 N Parkland Blvd E Unit 16
- 1933 N 1700 W
Your Personal Tour Guide
Ask me questions while you tour the home.