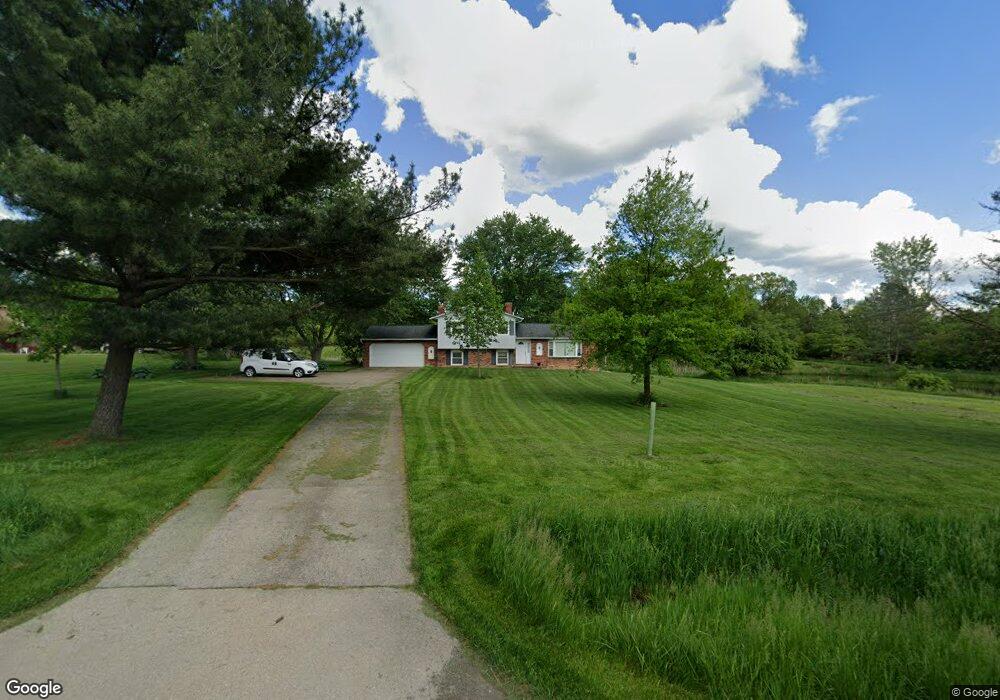
2545 Ridge Rd Hinckley, OH 44233
Estimated Value: $229,000 - $362,000
3
Beds
2
Baths
1,236
Sq Ft
$255/Sq Ft
Est. Value
About This Home
This home is located at 2545 Ridge Rd, Hinckley, OH 44233 and is currently estimated at $314,908, approximately $254 per square foot. 2545 Ridge Rd is a home located in Medina County with nearby schools including Highland Middle School and Highland High School.
Ownership History
Date
Name
Owned For
Owner Type
Purchase Details
Closed on
Dec 3, 2009
Sold by
Nevans Brian R
Bought by
Walters Matthew E
Current Estimated Value
Home Financials for this Owner
Home Financials are based on the most recent Mortgage that was taken out on this home.
Original Mortgage
$152,000
Outstanding Balance
$100,206
Interest Rate
5.11%
Mortgage Type
Future Advance Clause Open End Mortgage
Estimated Equity
$214,702
Purchase Details
Closed on
Aug 27, 2004
Sold by
Raus Edward E and Raus Sandra S
Bought by
Nevans Brian R and Walters Matthew E
Home Financials for this Owner
Home Financials are based on the most recent Mortgage that was taken out on this home.
Original Mortgage
$164,000
Interest Rate
6.1%
Mortgage Type
Purchase Money Mortgage
Purchase Details
Closed on
Apr 18, 2003
Sold by
Horvath Charles L
Bought by
Raus Edward E and Raus Sandra S
Purchase Details
Closed on
May 20, 2000
Sold by
Horvath Penny A and Horvath Penny
Bought by
Horvath Charles L
Create a Home Valuation Report for This Property
The Home Valuation Report is an in-depth analysis detailing your home's value as well as a comparison with similar homes in the area
Home Values in the Area
Average Home Value in this Area
Purchase History
| Date | Buyer | Sale Price | Title Company |
|---|---|---|---|
| Walters Matthew E | $104,210 | -- | |
| Nevans Brian R | $205,000 | Revere Title Agency Inc | |
| Raus Edward E | $204,000 | Ltic | |
| Horvath Charles L | -- | -- |
Source: Public Records
Mortgage History
| Date | Status | Borrower | Loan Amount |
|---|---|---|---|
| Open | Walters Matthew E | $152,000 | |
| Previous Owner | Nevans Brian R | $164,000 | |
| Closed | Nevans Brian R | $30,750 |
Source: Public Records
Tax History Compared to Growth
Tax History
| Year | Tax Paid | Tax Assessment Tax Assessment Total Assessment is a certain percentage of the fair market value that is determined by local assessors to be the total taxable value of land and additions on the property. | Land | Improvement |
|---|---|---|---|---|
| 2024 | $3,857 | $91,520 | $41,220 | $50,300 |
| 2023 | $3,857 | $91,520 | $41,220 | $50,300 |
| 2022 | $3,951 | $91,520 | $41,220 | $50,300 |
| 2021 | $3,574 | $75,640 | $34,070 | $41,570 |
| 2020 | $3,744 | $75,640 | $34,070 | $41,570 |
| 2019 | $3,760 | $75,640 | $34,070 | $41,570 |
| 2018 | $3,660 | $70,320 | $35,750 | $34,570 |
| 2017 | $3,685 | $70,320 | $35,750 | $34,570 |
| 2016 | $3,437 | $70,320 | $35,750 | $34,570 |
| 2015 | $3,224 | $63,350 | $32,210 | $31,140 |
| 2014 | $3,216 | $63,350 | $32,210 | $31,140 |
| 2013 | $3,222 | $63,350 | $32,210 | $31,140 |
Source: Public Records
Map
Nearby Homes
- 2641 Morning Star Dr
- 2316 Ridge Rd
- 2585 Stony Hill Rd
- 1816 Stone Ridge Dr
- 2165 Stony Hill Rd
- 2929 Stony Hill Rd
- 2333 Northgate Dr
- 1720 Hinckley Hills Rd
- 2344 Country Brook Dr
- 2600 Prairie Ln
- 920 Marwin Dr
- 2644 Prairie Ln
- 2633 Prairie Ln
- 2803 W 130th St
- BEDFORD Plan at Prairie Vista
- CRESTWOOD Plan at Prairie Vista
- VIOLA Plan at Prairie Vista
- CHAMP Plan at Prairie Vista
- ASH LAWN Plan at Prairie Vista
- SEBASTIAN Plan at Prairie Vista