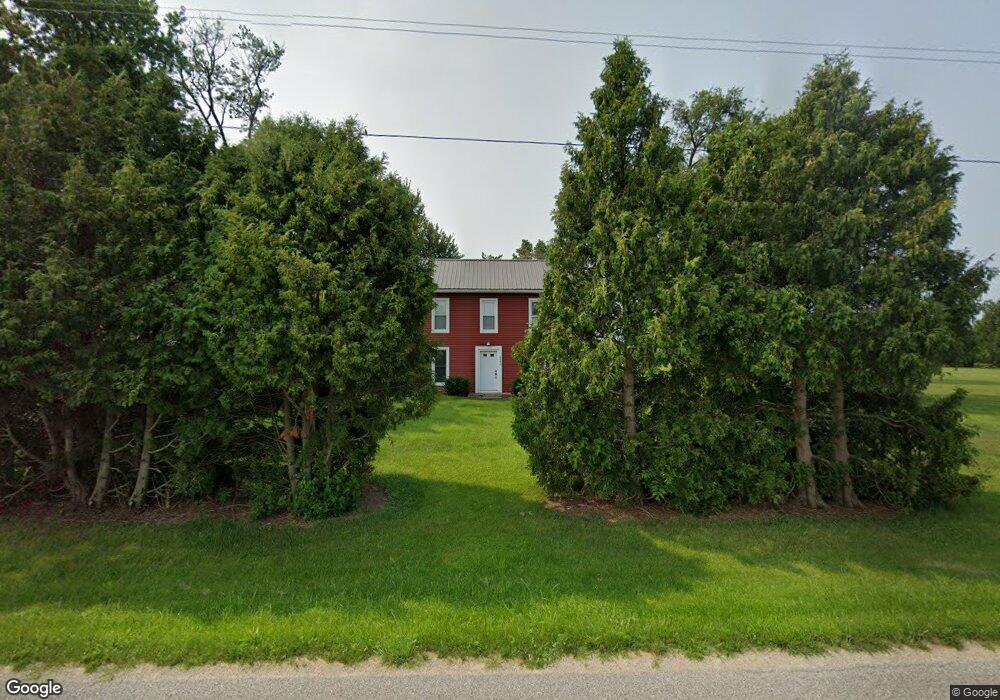
2546 Road 204 Antwerp, OH 45813
Estimated Value: $220,000 - $276,000
3
Beds
2
Baths
2,057
Sq Ft
$117/Sq Ft
Est. Value
About This Home
This home is located at 2546 Road 204, Antwerp, OH 45813 and is currently estimated at $239,884, approximately $116 per square foot. 2546 Road 204 is a home located in Paulding County with nearby schools including Antwerp Local Elementary School and Antwerp Local High School.
Ownership History
Date
Name
Owned For
Owner Type
Purchase Details
Closed on
Sep 19, 2016
Sold by
Dohoney Nathan J
Bought by
Dohoney Monica A
Current Estimated Value
Home Financials for this Owner
Home Financials are based on the most recent Mortgage that was taken out on this home.
Original Mortgage
$99,841
Outstanding Balance
$79,826
Interest Rate
3.46%
Mortgage Type
Future Advance Clause Open End Mortgage
Estimated Equity
$160,058
Purchase Details
Closed on
Apr 6, 2012
Sold by
Cottrell Robert E and Cottrell Catherine A
Bought by
Dohoney Nathan J and Dohoney Monica A
Home Financials for this Owner
Home Financials are based on the most recent Mortgage that was taken out on this home.
Original Mortgage
$105,000
Interest Rate
3.9%
Mortgage Type
Future Advance Clause Open End Mortgage
Purchase Details
Closed on
Jan 1, 1990
Bought by
Dohoney Nathan J and Dohoney Monica A
Create a Home Valuation Report for This Property
The Home Valuation Report is an in-depth analysis detailing your home's value as well as a comparison with similar homes in the area
Home Values in the Area
Average Home Value in this Area
Purchase History
| Date | Buyer | Sale Price | Title Company |
|---|---|---|---|
| Dohoney Monica A | -- | None Available | |
| Dohoney Nathan J | $60,000 | None Available | |
| Dohoney Nathan J | -- | -- |
Source: Public Records
Mortgage History
| Date | Status | Borrower | Loan Amount |
|---|---|---|---|
| Open | Dohoney Monica A | $99,841 | |
| Closed | Dohoney Nathan J | $105,000 |
Source: Public Records
Tax History Compared to Growth
Tax History
| Year | Tax Paid | Tax Assessment Tax Assessment Total Assessment is a certain percentage of the fair market value that is determined by local assessors to be the total taxable value of land and additions on the property. | Land | Improvement |
|---|---|---|---|---|
| 2024 | $1,833 | $53,030 | $8,890 | $44,140 |
| 2023 | $1,833 | $53,030 | $8,890 | $44,140 |
| 2022 | $1,805 | $53,030 | $8,890 | $44,140 |
| 2021 | $1,204 | $32,310 | $8,050 | $24,260 |
| 2020 | $1,237 | $32,310 | $8,050 | $24,260 |
| 2019 | $1,254 | $29,160 | $8,050 | $21,110 |
| 2018 | $1,114 | $29,160 | $8,050 | $21,110 |
| 2017 | $1,116 | $29,160 | $8,050 | $21,110 |
| 2016 | $1,116 | $29,160 | $8,050 | $21,110 |
| 2015 | $1,015 | $27,340 | $7,350 | $19,990 |
| 2014 | $788 | $21,490 | $7,350 | $14,140 |
| 2013 | $913 | $22,230 | $7,350 | $14,880 |
Source: Public Records
Map
Nearby Homes
- 3190 Road 204
- 136 Maumee Ln
- 13149 Road 27b
- 309 N Madison St
- 208 W River St
- 1258 Road 192
- 5092 Road 176
- 26100 Worden Rd
- TBD Allen Rd
- 24212 River Rd
- 24502 Indiana 37
- 16453 Road 63
- 11309 State Route 49
- 25812 Maumee Center Rd
- 11234 State Route 49
- 319 W High St
- 217 W Edgerton St
- 338 Chicago Ave
- 110 Sholl Terrace
- 307 Spencerville St