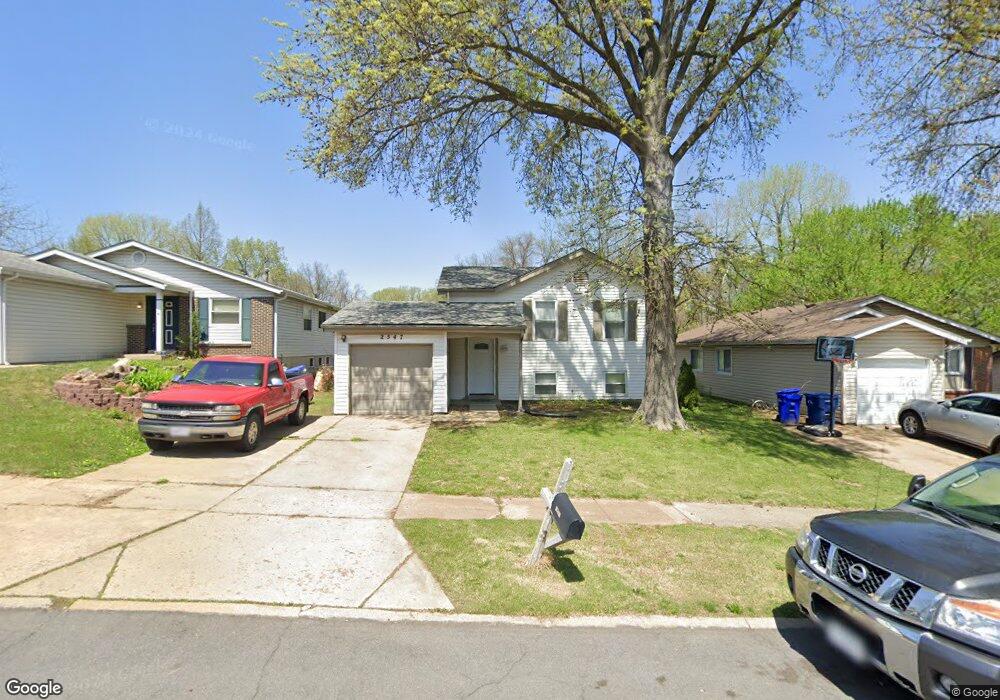
2547 Clovermere Ct Florissant, MO 63031
Estimated Value: $157,000 - $208,000
3
Beds
2
Baths
1,302
Sq Ft
$142/Sq Ft
Est. Value
About This Home
This home is located at 2547 Clovermere Ct, Florissant, MO 63031 and is currently estimated at $184,905, approximately $142 per square foot. 2547 Clovermere Ct is a home located in St. Louis County with nearby schools including Lawson Elementary School, West Middle School, and Hazelwood West High School.
Ownership History
Date
Name
Owned For
Owner Type
Purchase Details
Closed on
Jun 20, 2022
Sold by
Stone Jessica D
Bought by
Stone Jessica D
Current Estimated Value
Home Financials for this Owner
Home Financials are based on the most recent Mortgage that was taken out on this home.
Original Mortgage
$103,000
Outstanding Balance
$98,030
Interest Rate
5.3%
Mortgage Type
New Conventional
Estimated Equity
$86,875
Purchase Details
Closed on
Oct 11, 2013
Sold by
Chambers Roosevelt
Bought by
Terrill Jessica D
Home Financials for this Owner
Home Financials are based on the most recent Mortgage that was taken out on this home.
Original Mortgage
$84,442
Interest Rate
5.5%
Mortgage Type
FHA
Purchase Details
Closed on
May 31, 2013
Sold by
Mu Investment Property Llc
Bought by
Chambers Roosevelt
Purchase Details
Closed on
Dec 6, 2012
Sold by
Crowder Kenneth
Bought by
Mu Investment Property Llc
Purchase Details
Closed on
Jun 2, 2009
Sold by
G Stafford Company
Bought by
Crowder Kenneth
Home Financials for this Owner
Home Financials are based on the most recent Mortgage that was taken out on this home.
Original Mortgage
$125,353
Interest Rate
4.72%
Mortgage Type
Seller Take Back
Purchase Details
Closed on
Oct 14, 2008
Sold by
Drew Paul D and Drew Tabitha L
Bought by
G Stafford Co
Purchase Details
Closed on
Jun 12, 2008
Sold by
G Stafford Co
Bought by
Drew Paul D and Drew Tabitha L
Home Financials for this Owner
Home Financials are based on the most recent Mortgage that was taken out on this home.
Original Mortgage
$138,408
Interest Rate
6.07%
Mortgage Type
Seller Take Back
Purchase Details
Closed on
Dec 17, 2007
Sold by
Kasper Shirley
Bought by
G Stafford Co
Purchase Details
Closed on
Oct 27, 2006
Sold by
G Stafford Co
Bought by
Kasper Shirley
Home Financials for this Owner
Home Financials are based on the most recent Mortgage that was taken out on this home.
Original Mortgage
$90,000
Interest Rate
6.37%
Mortgage Type
Seller Take Back
Purchase Details
Closed on
Aug 30, 2006
Sold by
Kasper Shirley
Bought by
G Stafford Co
Home Financials for this Owner
Home Financials are based on the most recent Mortgage that was taken out on this home.
Original Mortgage
$90,000
Interest Rate
6.37%
Mortgage Type
Seller Take Back
Purchase Details
Closed on
Aug 14, 1997
Sold by
Kasper Shirley M and Kasper Beverly S
Bought by
Kasper Shirley M
Create a Home Valuation Report for This Property
The Home Valuation Report is an in-depth analysis detailing your home's value as well as a comparison with similar homes in the area
Home Values in the Area
Average Home Value in this Area
Purchase History
| Date | Buyer | Sale Price | Title Company |
|---|---|---|---|
| Stone Jessica D | -- | None Listed On Document | |
| Terrill Jessica D | $86,000 | Investors Title Co Clayton | |
| Chambers Roosevelt | -- | Us Title Main | |
| Mu Investment Property Llc | $52,500 | None Available | |
| Crowder Kenneth | -- | None Available | |
| G Stafford Co | $90,000 | None Available | |
| Drew Paul D | $139,900 | Investors Title Company | |
| G Stafford Co | $90,000 | None Available | |
| Kasper Shirley | $105,000 | None Available | |
| G Stafford Co | $85,837 | None Available | |
| Kasper Shirley M | -- | -- |
Source: Public Records
Mortgage History
| Date | Status | Borrower | Loan Amount |
|---|---|---|---|
| Open | Stone Jessica D | $103,000 | |
| Previous Owner | Terrill Jessica D | $84,442 | |
| Previous Owner | Crowder Kenneth | $125,353 | |
| Previous Owner | Drew Paul D | $138,408 | |
| Previous Owner | Kasper Shirley | $90,000 | |
| Previous Owner | G Stafford Co | $86,877 |
Source: Public Records
Tax History Compared to Growth
Tax History
| Year | Tax Paid | Tax Assessment Tax Assessment Total Assessment is a certain percentage of the fair market value that is determined by local assessors to be the total taxable value of land and additions on the property. | Land | Improvement |
|---|---|---|---|---|
| 2025 | $2,036 | $27,760 | $4,520 | $23,240 |
| 2024 | $2,036 | $22,650 | $3,020 | $19,630 |
| 2023 | $2,033 | $22,650 | $3,020 | $19,630 |
| 2022 | $1,944 | $19,310 | $3,460 | $15,850 |
| 2021 | $1,894 | $19,310 | $3,460 | $15,850 |
| 2020 | $1,764 | $16,930 | $3,020 | $13,910 |
| 2019 | $1,738 | $16,930 | $3,020 | $13,910 |
| 2018 | $1,778 | $15,940 | $2,390 | $13,550 |
| 2017 | $1,776 | $15,940 | $2,390 | $13,550 |
| 2016 | $1,776 | $15,730 | $2,390 | $13,340 |
| 2015 | $1,739 | $15,730 | $2,390 | $13,340 |
| 2014 | $1,712 | $15,960 | $2,740 | $13,220 |
Source: Public Records
Map
Nearby Homes
- 2 Belmont at River Bluffs Meadows
- 2 Fieldcrest at River Bluffs Meadows
- 2620 Lindsay Ln
- 2 Sterling at River Bluffs Manors
- 2 Meadows
- 2 Royal II at River Bluffs Manors
- 2 Aspen at River Bluffs Manors Unit Aspen at River Bluff
- 2 Maple at River Bluffs Manors
- 2 Aspen II at River Bluffs Manors
- 2 Ashford at River Bluffs Manors
- 2 Meadows
- 2 Berwick at River Bluffs Manors
- 2 Carolina at River Bluffs Meadows
- 2484 Blue Heron Dr
- 2487 Manthorne Ct
- 2165 Jenkee Dr
- 2515 Flamingo Dr
- 282 Noser Dr
- 2 Aspen II at Koch Park Manors
- 275 Noser Dr
- 2567 Clovermere Ct
- 2539 Clovermere Ct
- 2577 Clovermere Ct
- 2537 Clovermere Ct
- 2587 Clovermere Ct
- 0000 Clovermere Ct Lower Level
- 2527 Clovermere Ct
- 2546 Clovermere Ct
- 2556 Clovermere Ct
- 2597 Clovermere Ct
- 2536 Clovermere Ct
- 2566 Clovermere Ct
- 2526 Clovermere Ct
- 2517 Clovermere Ct
- 2576 Clovermere Ct
- 2516 Clovermere Ct
- 2586 Clovermere Ct
- 2607 Clovermere Ct
- 2588 Clovermere Ct
- 2507 Clovermere Ct