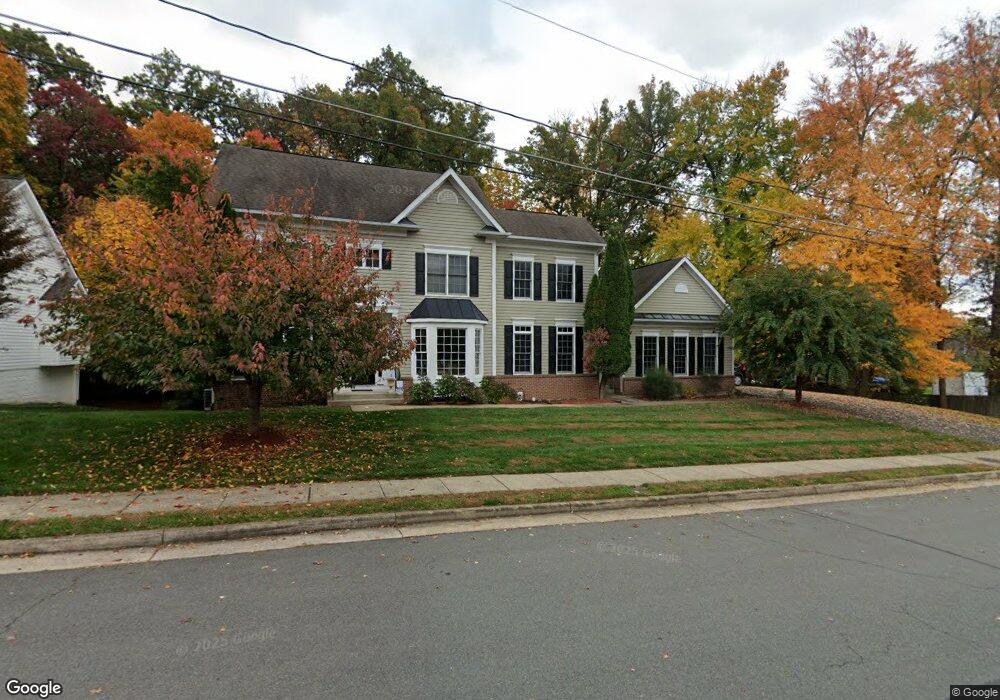
2547 Sandburg St Dunn Loring, VA 22027
Estimated Value: $1,337,000 - $1,483,000
5
Beds
5
Baths
3,693
Sq Ft
$376/Sq Ft
Est. Value
About This Home
This home is located at 2547 Sandburg St, Dunn Loring, VA 22027 and is currently estimated at $1,390,063, approximately $376 per square foot. 2547 Sandburg St is a home located in Fairfax County with nearby schools including Stenwood Elementary School, Thoreau Middle School, and Marshall High School.
Ownership History
Date
Name
Owned For
Owner Type
Purchase Details
Closed on
Jul 27, 2023
Sold by
Wong Mary and Le Peter P
Bought by
Wong Mary and Le Peter P
Current Estimated Value
Purchase Details
Closed on
Jan 22, 2013
Sold by
Alg Trustee Llc and Bean David L
Bought by
Venus Properties Llc
Purchase Details
Closed on
Dec 19, 2011
Sold by
Venus Properties Llc
Bought by
Le Peter P
Home Financials for this Owner
Home Financials are based on the most recent Mortgage that was taken out on this home.
Original Mortgage
$608,000
Interest Rate
3.99%
Mortgage Type
New Conventional
Purchase Details
Closed on
Oct 6, 2011
Sold by
Recontrust Company Na and Bean David L
Bought by
Venus Properties Llc
Purchase Details
Closed on
Feb 5, 1999
Sold by
Lawrence Doll Homes
Bought by
Bean David L
Home Financials for this Owner
Home Financials are based on the most recent Mortgage that was taken out on this home.
Original Mortgage
$315,700
Interest Rate
6.74%
Create a Home Valuation Report for This Property
The Home Valuation Report is an in-depth analysis detailing your home's value as well as a comparison with similar homes in the area
Home Values in the Area
Average Home Value in this Area
Purchase History
| Date | Buyer | Sale Price | Title Company |
|---|---|---|---|
| Wong Mary | -- | None Listed On Document | |
| Venus Properties Llc | $653,000 | -- | |
| Le Peter P | $760,000 | -- | |
| Venus Properties Llc | $653,000 | -- | |
| Bean David L | $394,678 | -- |
Source: Public Records
Mortgage History
| Date | Status | Borrower | Loan Amount |
|---|---|---|---|
| Previous Owner | Le Peter P | $608,000 | |
| Previous Owner | Bean David L | $315,700 |
Source: Public Records
Tax History Compared to Growth
Tax History
| Year | Tax Paid | Tax Assessment Tax Assessment Total Assessment is a certain percentage of the fair market value that is determined by local assessors to be the total taxable value of land and additions on the property. | Land | Improvement |
|---|---|---|---|---|
| 2025 | $14,031 | $1,168,640 | $431,000 | $737,640 |
| 2024 | $14,031 | $1,144,440 | $421,000 | $723,440 |
| 2023 | $13,420 | $1,133,720 | $421,000 | $712,720 |
| 2022 | $12,884 | $1,073,880 | $411,000 | $662,880 |
| 2021 | $11,486 | $935,140 | $391,000 | $544,140 |
| 2020 | $11,089 | $896,600 | $391,000 | $505,600 |
| 2019 | $11,009 | $888,690 | $391,000 | $497,690 |
| 2018 | $9,932 | $863,690 | $366,000 | $497,690 |
| 2017 | $10,074 | $828,690 | $331,000 | $497,690 |
| 2016 | $10,313 | $849,430 | $331,000 | $518,430 |
| 2015 | $9,724 | $829,260 | $321,000 | $508,260 |
| 2014 | $9,590 | $819,260 | $311,000 | $508,260 |
Source: Public Records
Map
Nearby Homes
- 2539 Gallows Rd
- 8217 Bucknell Dr
- 2665 Manhattan Place Unit 109
- 2711 Bellforest Ct Unit 201
- 8313 Syracuse Cir
- 8308 Colby St
- 8183 Carnegie Hall Ct Unit 209
- 2407 Lellah Ct
- 2726 Gallows Rd Unit 1004
- 2726 Gallows Rd Unit 411
- 2665 Prosperity Ave Unit 345
- 2665 Prosperity Ave Unit 111
- 2418 Holt St
- 7914 Idylwood Rd
- LOT 29 Wesleyan St
- 8407 Berea Ct
- 2423 Jackson Pkwy
- 2415 Jackson Pkwy
- 2633 Wooster Ct
- 8419 Wesleyan St
- 2543 Sandburg St
- 8121 Sandburg Hill Ct
- 2541 Sandburg St Unit 1 Room
- 2541 Sandburg St
- 8120 Sandburg Hill Ct
- 2601 Sandburg St
- 8123 Sandburg Hill Ct
- 8051 Prichards Ct
- 2539 Sandburg St
- 8101 Timber Valley Ct
- 8122 Sandburg Hill Ct
- 8103 Cottage St
- 2537 Sandburg St
- 8053 Prichards Ct
- 8125 Sandburg Hill Ct
- 8105 Cottage St
- 8124 Sandburg Hill Ct
- 8105 Timber Valley Ct
- 2535 Sandburg St
- 8127 Sandburg Hill Ct