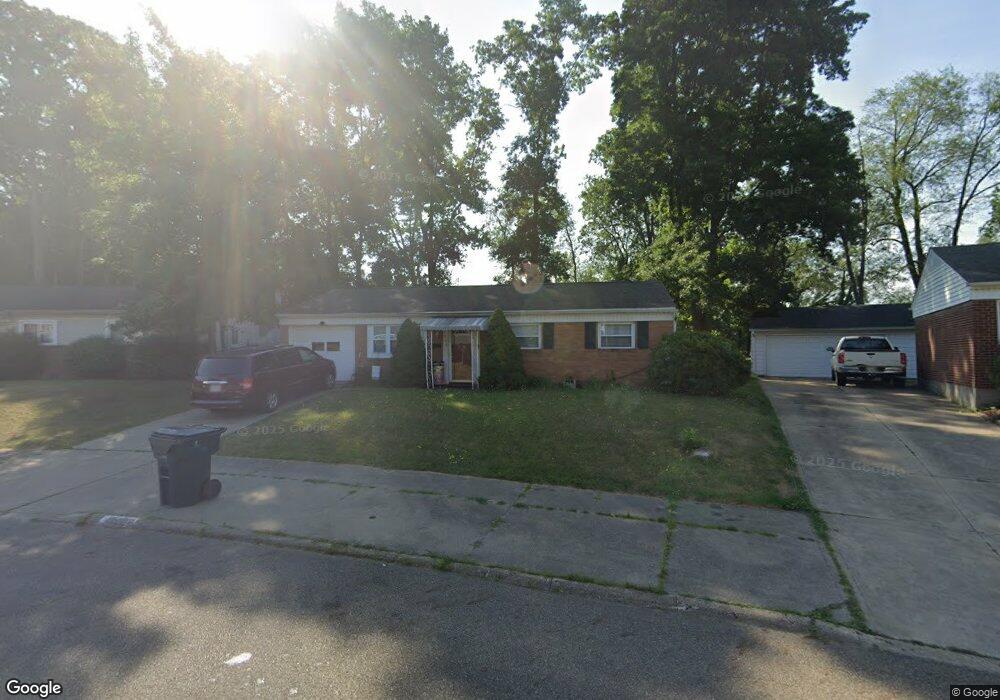
2548 Cathy Dr NE Canton, OH 44705
Plain Township NeighborhoodEstimated Value: $143,502 - $182,000
3
Beds
2
Baths
962
Sq Ft
$168/Sq Ft
Est. Value
About This Home
This home is located at 2548 Cathy Dr NE, Canton, OH 44705 and is currently estimated at $161,626, approximately $168 per square foot. 2548 Cathy Dr NE is a home located in Stark County with nearby schools including Ransom H. Barr Elementary School, Glenwood Intermediate School, and GlenOak High School.
Ownership History
Date
Name
Owned For
Owner Type
Purchase Details
Closed on
Apr 10, 2009
Sold by
Gijo Llc
Bought by
Cowley Jolynn B and Buchert Earl W
Current Estimated Value
Purchase Details
Closed on
Aug 29, 2008
Sold by
Wells Fargo Na
Bought by
Gijo Llc
Purchase Details
Closed on
Aug 4, 2008
Sold by
Watson Brian K and Watson Michelle L
Bought by
Wells Fargo Bank Na and National City Mortgage Loan Trust 2005-1
Purchase Details
Closed on
Aug 18, 2004
Sold by
Kelly Harold W
Bought by
Watson Brian K and Watson Michelle L
Home Financials for this Owner
Home Financials are based on the most recent Mortgage that was taken out on this home.
Original Mortgage
$68,000
Interest Rate
6.1%
Mortgage Type
Purchase Money Mortgage
Purchase Details
Closed on
Feb 27, 2004
Sold by
Estate Of Harold R Johnston
Bought by
Johnston Eleanor J
Create a Home Valuation Report for This Property
The Home Valuation Report is an in-depth analysis detailing your home's value as well as a comparison with similar homes in the area
Home Values in the Area
Average Home Value in this Area
Purchase History
| Date | Buyer | Sale Price | Title Company |
|---|---|---|---|
| Cowley Jolynn B | $79,000 | Attorney | |
| Gijo Llc | $38,500 | Attorney | |
| Wells Fargo Bank Na | $70,998 | None Available | |
| Watson Brian K | $85,000 | -- | |
| Johnston Eleanor J | -- | -- |
Source: Public Records
Mortgage History
| Date | Status | Borrower | Loan Amount |
|---|---|---|---|
| Previous Owner | Watson Brian K | $68,000 | |
| Closed | Watson Brian K | $17,000 |
Source: Public Records
Tax History Compared to Growth
Tax History
| Year | Tax Paid | Tax Assessment Tax Assessment Total Assessment is a certain percentage of the fair market value that is determined by local assessors to be the total taxable value of land and additions on the property. | Land | Improvement |
|---|---|---|---|---|
| 2025 | -- | $34,030 | $15,160 | $18,870 |
| 2024 | -- | $34,030 | $15,160 | $18,870 |
| 2023 | $1,187 | $24,890 | $9,170 | $15,720 |
| 2022 | $1,195 | $24,890 | $9,170 | $15,720 |
| 2021 | $1,174 | $24,890 | $9,170 | $15,720 |
| 2020 | $1,119 | $21,600 | $7,910 | $13,690 |
| 2019 | $1,110 | $21,600 | $7,910 | $13,690 |
| 2018 | $1,096 | $21,600 | $7,910 | $13,690 |
| 2017 | $1,090 | $19,710 | $6,830 | $12,880 |
| 2016 | $1,092 | $19,710 | $6,830 | $12,880 |
| 2015 | $1,056 | $19,710 | $6,830 | $12,880 |
| 2014 | $1,108 | $20,230 | $7,000 | $13,230 |
| 2013 | $542 | $20,230 | $7,000 | $13,230 |
Source: Public Records
Map
Nearby Homes
- 3305 Regent Ave NE
- 4123 Regentview St NE
- 3022 Taft Ave NE
- 3023 Bollinger Ave NE
- 3015 Bollinger Ave NE
- 1912 40th St NE
- 1902 39th St NE
- 4701 Roosevelt Ave NE
- 1644 33rd St NE
- 2017 28th St NE
- 1852 Southpointe Cir NE Unit 39W
- 4015 Pelham St NE Unit 3A
- 2211 48th St NE
- 2941 Fletcher Ave NE
- 1601 33rd St NE
- 1709 Southpointe Cir NE Unit 25W
- 2216 49th St NE
- 2827 Daleford Ave NE
- 0 St Elmo Ave NE Unit 5159780
- 0 St Elmo Ave NE Unit 5089961
- 2544 Cathy Dr NE
- 2552 Cathy Dr NE
- 2540 Cathy Dr NE
- 2545 Cathy Dr NE
- 2536 Cathy Dr NE
- 2564 Cathy Dr NE
- 2555 Cathy Dr NE
- 2530 Cathy Dr NE
- 2533 Cathy Dr NE
- 2565 Cathy Dr NE
- 2570 Cathy Dr NE
- 2571 Cathy Dr NE
- 2527 Cathy Dr NE
- 2524 Cathy Dr NE
- 2576 Cathy Dr NE
- 2521 Cathy Dr NE
- 2518 Cathy Dr NE
- 2575 Cathy Dr NE
- 3800 Regentview St NE
- 2520 Regentview St NE