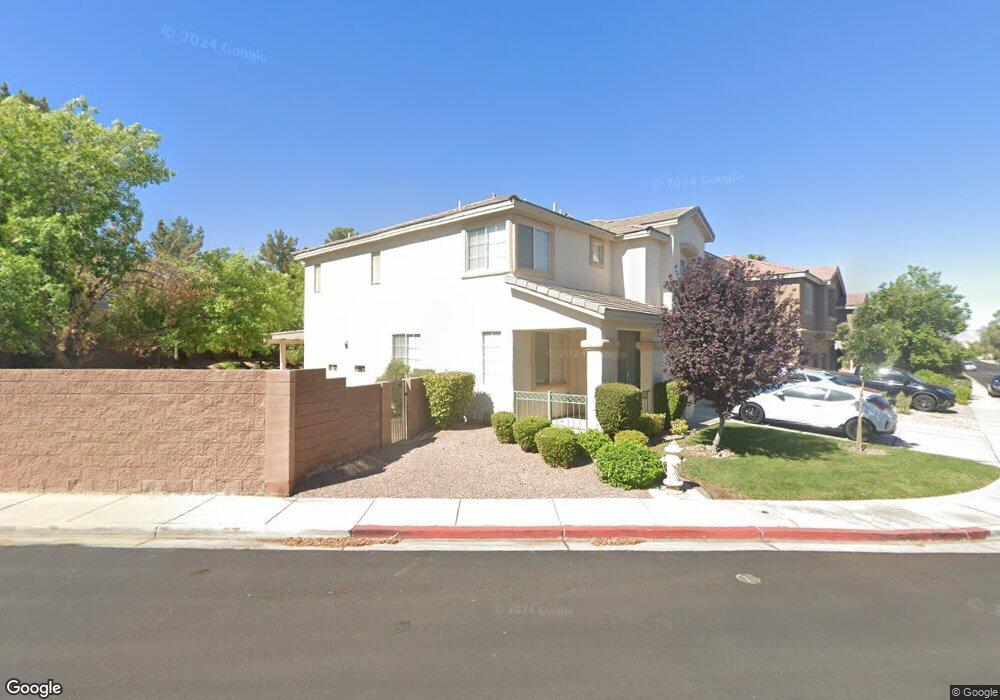
2549 Prince Edward Dr Henderson, NV 89052
MacDonald Ranch NeighborhoodEstimated Value: $666,234 - $750,000
5
Beds
3
Baths
2,966
Sq Ft
$237/Sq Ft
Est. Value
About This Home
This home is located at 2549 Prince Edward Dr, Henderson, NV 89052 and is currently estimated at $703,559, approximately $237 per square foot. 2549 Prince Edward Dr is a home located in Clark County with nearby schools including Glen C. Taylor Elementary School, Bob Miller Middle School, and Coronado High School.
Ownership History
Date
Name
Owned For
Owner Type
Purchase Details
Closed on
Feb 25, 2005
Sold by
Heaton Harper Victoria and Harper Anne
Bought by
Pugh Thomas R and Pugh Lisa A
Current Estimated Value
Home Financials for this Owner
Home Financials are based on the most recent Mortgage that was taken out on this home.
Original Mortgage
$350,000
Outstanding Balance
$162,566
Interest Rate
4.75%
Mortgage Type
Unknown
Estimated Equity
$540,993
Purchase Details
Closed on
Sep 4, 2002
Sold by
Barbian Darrin J
Bought by
Heaton Harper Victoria and Harper Anne
Home Financials for this Owner
Home Financials are based on the most recent Mortgage that was taken out on this home.
Original Mortgage
$219,200
Interest Rate
6.24%
Purchase Details
Closed on
Aug 18, 1999
Sold by
Barbian Jennie M
Bought by
Barbian Darrin J
Home Financials for this Owner
Home Financials are based on the most recent Mortgage that was taken out on this home.
Original Mortgage
$190,650
Interest Rate
7.63%
Create a Home Valuation Report for This Property
The Home Valuation Report is an in-depth analysis detailing your home's value as well as a comparison with similar homes in the area
Home Values in the Area
Average Home Value in this Area
Purchase History
| Date | Buyer | Sale Price | Title Company |
|---|---|---|---|
| Pugh Thomas R | $470,000 | Equity Title Of Nevada | |
| Heaton Harper Victoria | $274,000 | Nevada Title Company | |
| Barbian Darrin J | -- | First American Title Co | |
| Barbian Darrin J | $203,000 | First American Title Co |
Source: Public Records
Mortgage History
| Date | Status | Borrower | Loan Amount |
|---|---|---|---|
| Open | Pugh Thomas R | $350,000 | |
| Previous Owner | Heaton Harper Victoria | $219,200 | |
| Previous Owner | Barbian Darrin J | $190,650 | |
| Closed | Heaton Harper Victoria | $21,200 |
Source: Public Records
Tax History
| Year | Tax Paid | Tax Assessment Tax Assessment Total Assessment is a certain percentage of the fair market value that is determined by local assessors to be the total taxable value of land and additions on the property. | Land | Improvement |
|---|---|---|---|---|
| 2026 | $2,797 | $153,779 | $58,800 | $94,979 |
| 2025 | $2,715 | $146,193 | $49,613 | $96,580 |
| 2024 | $2,636 | $146,193 | $49,613 | $96,580 |
| 2023 | $2,636 | $137,111 | $45,570 | $91,541 |
| 2022 | $2,656 | $122,943 | $39,323 | $83,620 |
| 2021 | $2,492 | $113,001 | $33,443 | $79,558 |
| 2020 | $2,416 | $112,366 | $33,443 | $78,923 |
| 2019 | $2,346 | $104,976 | $27,195 | $77,781 |
| 2018 | $2,278 | $99,179 | $24,990 | $74,189 |
| 2017 | $2,751 | $97,561 | $22,418 | $75,143 |
| 2016 | $2,157 | $92,066 | $15,435 | $76,631 |
| 2015 | $2,153 | $86,748 | $15,803 | $70,945 |
| 2014 | $2,090 | $74,856 | $9,555 | $65,301 |
Source: Public Records
Map
Nearby Homes
- 894 Sir Winston St
- 2569 Wiltshire Ave
- 2570 Swans Chance Ave
- 848 Sandhill Sage St
- 2571 Swans Chance Ave
- 2495 Kaymin Ridge Rd
- 700 Carnegie St Unit 3023
- 700 Carnegie St Unit 4113
- 700 Carnegie St Unit 2022
- 700 Carnegie St Unit 4112
- 700 Carnegie St Unit 1124
- 700 Carnegie St Unit 1311
- 700 Carnegie St Unit 1814
- 700 Carnegie St Unit 2011
- 700 Carnegie St Unit 4621
- 700 Carnegie St Unit 1423
- 700 Carnegie St Unit 2621
- 980 Upper Meadows Place
- 830 Carnegie St Unit 1613
- 830 Carnegie St Unit 623
- 2551 Prince Edward Dr
- 2548 Williamsburg St
- 2550 Williamsburg St
- 2552 Williamsburg St
- 916 Lloyd George Dr
- 914 Lloyd George Dr
- 918 Lloyd George Dr
- 896 Sir Raleigh Ct
- 2548 Prince Edward Dr
- 912 Lloyd George Dr
- 894 Sir Raleigh Ct
- 900 Sir Raleigh Ct
- 898 Sir Raleigh Ct
- 2554 Williamsburg St
- 2550 Prince Edward Dr
- 920 Lloyd George Dr
- 2552 Prince Edward Dr
- 800 Binbrook Dr
- 2556 Williamsburg St
- 2549 Williamsburg St