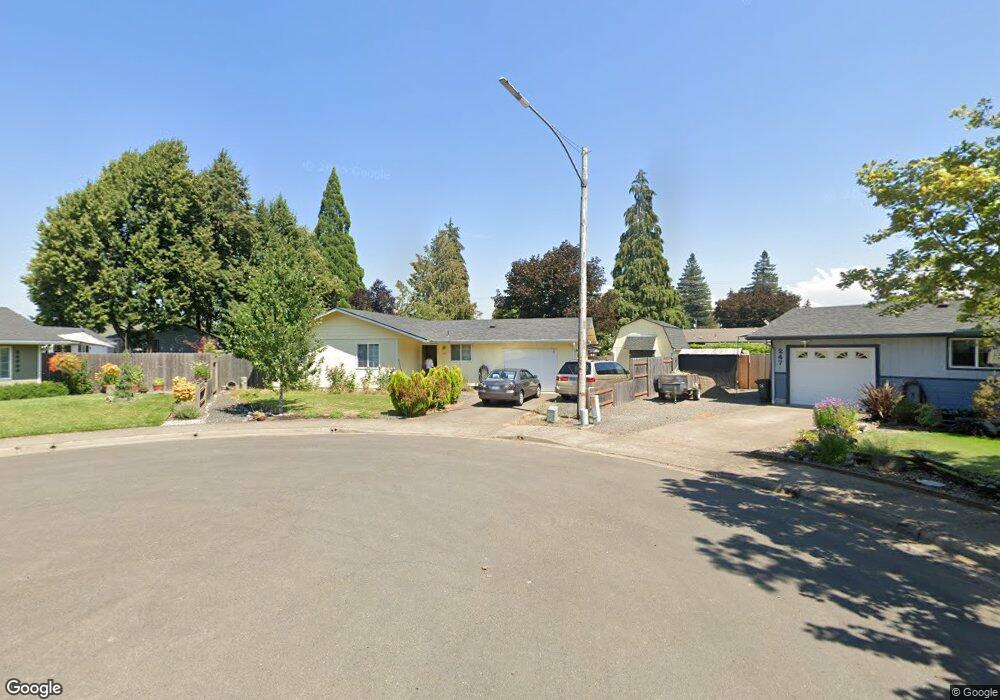
255 35th St Springfield, OR 97478
East Springfield NeighborhoodEstimated Value: $324,000 - $343,000
3
Beds
1
Bath
963
Sq Ft
$345/Sq Ft
Est. Value
About This Home
This home is located at 255 35th St, Springfield, OR 97478 and is currently estimated at $332,203, approximately $344 per square foot. 255 35th St is a home located in Lane County with nearby schools including Riverbend Elementary School, Briggs Middle School, and Thurston High School.
Ownership History
Date
Name
Owned For
Owner Type
Purchase Details
Closed on
Jan 5, 2010
Sold by
Us Bank National Association
Bought by
Sandoval Maximino and Damian Guadalupe
Current Estimated Value
Home Financials for this Owner
Home Financials are based on the most recent Mortgage that was taken out on this home.
Original Mortgage
$101,520
Outstanding Balance
$66,660
Interest Rate
5.11%
Mortgage Type
New Conventional
Estimated Equity
$265,543
Purchase Details
Closed on
Nov 5, 2009
Sold by
Ramirez Reuben and Ramirez Erin G
Bought by
Us Bank National Association
Purchase Details
Closed on
Feb 12, 1998
Sold by
County Inc St Vincent De Paul Society Of Lane
Bought by
Ramirez Reuben and Ramirez Erin G
Home Financials for this Owner
Home Financials are based on the most recent Mortgage that was taken out on this home.
Original Mortgage
$61,750
Interest Rate
9.4%
Create a Home Valuation Report for This Property
The Home Valuation Report is an in-depth analysis detailing your home's value as well as a comparison with similar homes in the area
Home Values in the Area
Average Home Value in this Area
Purchase History
| Date | Buyer | Sale Price | Title Company |
|---|---|---|---|
| Sandoval Maximino | $126,900 | First American Title | |
| Us Bank National Association | $131,750 | First American Title | |
| Ramirez Reuben | $95,000 | Western Pioneer Title Co |
Source: Public Records
Mortgage History
| Date | Status | Borrower | Loan Amount |
|---|---|---|---|
| Open | Sandoval Maximino | $101,520 | |
| Previous Owner | Ramirez Reuben | $61,750 |
Source: Public Records
Tax History
| Year | Tax Paid | Tax Assessment Tax Assessment Total Assessment is a certain percentage of the fair market value that is determined by local assessors to be the total taxable value of land and additions on the property. | Land | Improvement |
|---|---|---|---|---|
| 2025 | $2,744 | $149,659 | -- | -- |
| 2024 | $2,700 | $145,300 | -- | -- |
| 2023 | $2,700 | $141,068 | $0 | $0 |
| 2022 | $2,501 | $136,960 | $0 | $0 |
| 2021 | $2,456 | $132,971 | $0 | $0 |
| 2020 | $2,384 | $129,099 | $0 | $0 |
| 2019 | $2,312 | $125,339 | $0 | $0 |
| 2018 | $2,180 | $118,145 | $0 | $0 |
| 2017 | $2,096 | $118,145 | $0 | $0 |
| 2016 | $2,052 | $114,704 | $0 | $0 |
| 2015 | $1,993 | $111,363 | $0 | $0 |
| 2014 | $1,963 | $108,119 | $0 | $0 |
Source: Public Records
Map
Nearby Homes
Your Personal Tour Guide
Ask me questions while you tour the home.