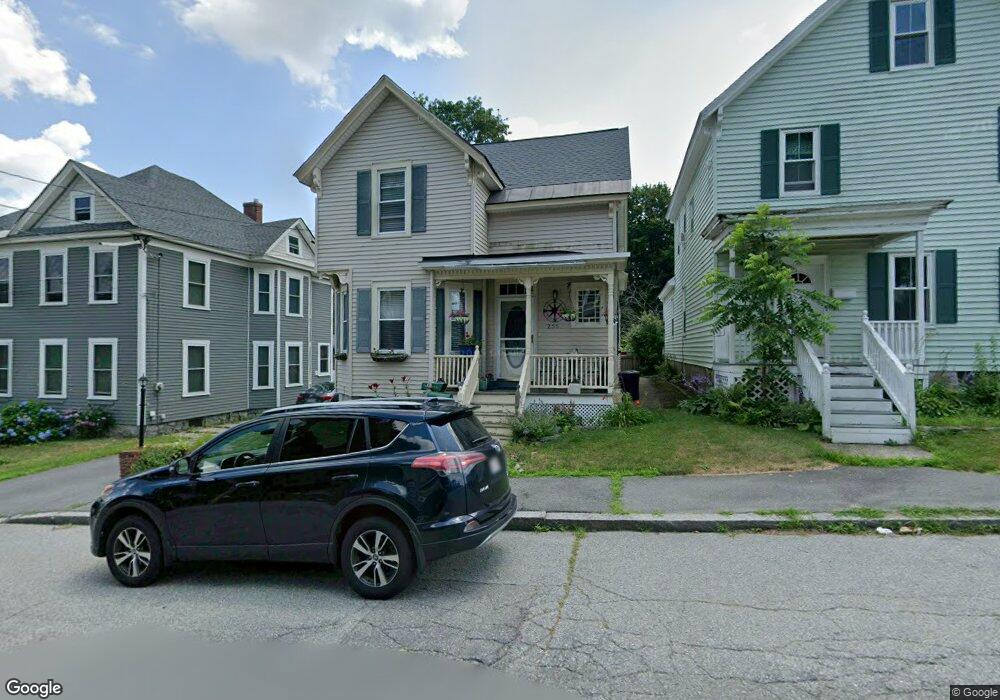
255 3rd St Lowell, MA 01850
Centralville NeighborhoodEstimated Value: $454,690 - $553,000
4
Beds
1
Bath
1,575
Sq Ft
$308/Sq Ft
Est. Value
About This Home
This home is located at 255 3rd St, Lowell, MA 01850 and is currently estimated at $485,173, approximately $308 per square foot. 255 3rd St is a home located in Middlesex County with nearby schools including S. Christa McAuliffe Elementary School, Greenhalge Elementary School, and Moody Elementary School.
Ownership History
Date
Name
Owned For
Owner Type
Purchase Details
Closed on
Jul 31, 2017
Sold by
Lamarche Leo A and Lamarche Nancy T
Bought by
Nancy T Lamarche Irt and Rondeau
Current Estimated Value
Purchase Details
Closed on
Aug 15, 1988
Sold by
Lanthier Jean M
Bought by
Lamarche Leo A
Home Financials for this Owner
Home Financials are based on the most recent Mortgage that was taken out on this home.
Original Mortgage
$106,400
Interest Rate
10.34%
Mortgage Type
Purchase Money Mortgage
Create a Home Valuation Report for This Property
The Home Valuation Report is an in-depth analysis detailing your home's value as well as a comparison with similar homes in the area
Home Values in the Area
Average Home Value in this Area
Purchase History
| Date | Buyer | Sale Price | Title Company |
|---|---|---|---|
| Nancy T Lamarche Irt | -- | -- | |
| Nancy T Lamarche Irt | -- | -- | |
| Lamarche Leo A | $112,000 | -- |
Source: Public Records
Mortgage History
| Date | Status | Borrower | Loan Amount |
|---|---|---|---|
| Previous Owner | Lamarche Leo A | $95,000 | |
| Previous Owner | Lamarche Leo A | $106,400 |
Source: Public Records
Tax History Compared to Growth
Tax History
| Year | Tax Paid | Tax Assessment Tax Assessment Total Assessment is a certain percentage of the fair market value that is determined by local assessors to be the total taxable value of land and additions on the property. | Land | Improvement |
|---|---|---|---|---|
| 2025 | $4,736 | $412,500 | $136,100 | $276,400 |
| 2024 | $4,619 | $387,800 | $127,200 | $260,600 |
| 2023 | $4,352 | $350,400 | $110,600 | $239,800 |
| 2022 | $4,058 | $319,800 | $100,600 | $219,200 |
| 2021 | $3,785 | $281,200 | $87,500 | $193,700 |
| 2020 | $3,479 | $260,400 | $76,400 | $184,000 |
| 2019 | $3,232 | $230,200 | $70,700 | $159,500 |
| 2018 | $3,156 | $219,300 | $67,400 | $151,900 |
| 2017 | $3,050 | $204,400 | $61,300 | $143,100 |
| 2016 | $2,894 | $190,900 | $59,800 | $131,100 |
| 2015 | $2,807 | $181,300 | $59,800 | $121,500 |
| 2013 | $2,657 | $177,000 | $69,900 | $107,100 |
Source: Public Records
Map
Nearby Homes
- 21 Vernon St
- 81 Reservoir St
- 42 Christian St Unit Lot 17
- 192 1st St
- 164 Bradley St
- Lot 11 Christian St
- Lot 12 Christian St
- Lot 9 Christian St
- Lot 10 Christian St
- 284 Beacon St
- 94 1st St Unit 10
- 49 6th St
- 100 Merrimack Ave Unit 25
- 330 Christian St
- 45 W 4th St
- 11 Hampshire St
- 26 July St
- 18 May St
- 73 W 4th St
- 16 Winding Ln