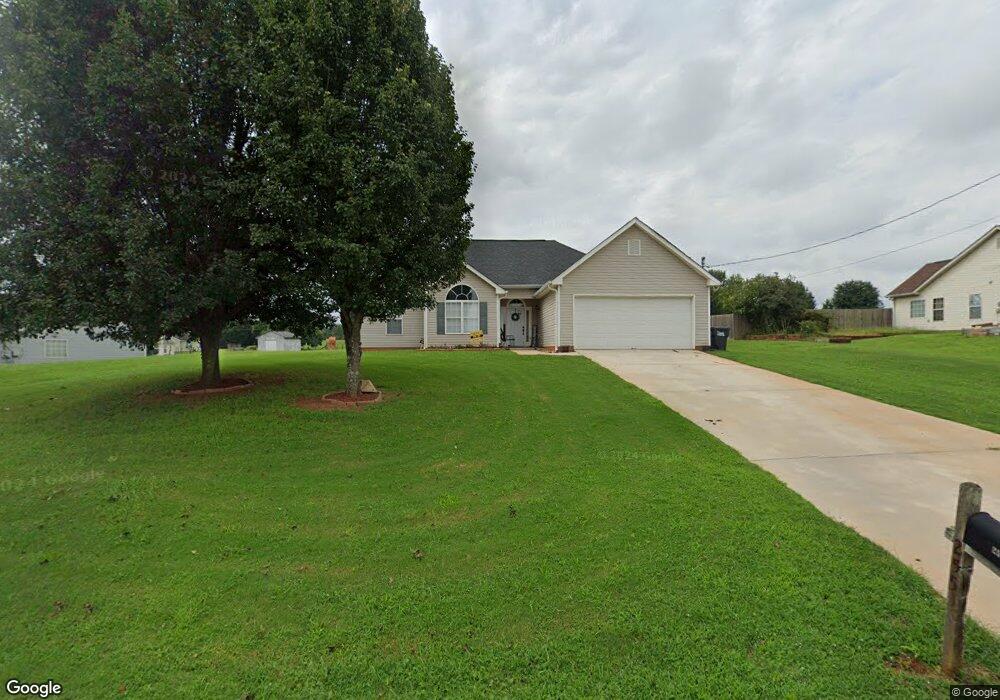
255 Claremont Dr Unit 2 Covington, GA 30016
Estimated Value: $266,000 - $289,000
--
Bed
2
Baths
1,522
Sq Ft
$180/Sq Ft
Est. Value
About This Home
This home is located at 255 Claremont Dr Unit 2, Covington, GA 30016 and is currently estimated at $273,443, approximately $179 per square foot. 255 Claremont Dr Unit 2 is a home located in Newton County with nearby schools including South Salem Elementary School, Liberty Middle School, and Alcovy High School.
Ownership History
Date
Name
Owned For
Owner Type
Purchase Details
Closed on
Feb 6, 2018
Sold by
Jones Freddie
Bought by
Lee Tracey L
Current Estimated Value
Purchase Details
Closed on
Aug 18, 2008
Sold by
Jones Freddie
Bought by
Lee Tracey L
Purchase Details
Closed on
May 26, 2006
Sold by
Coots Gary
Bought by
Lee-Jones Tracey L
Home Financials for this Owner
Home Financials are based on the most recent Mortgage that was taken out on this home.
Original Mortgage
$127,646
Interest Rate
6.44%
Mortgage Type
FHA
Purchase Details
Closed on
Jan 26, 2006
Sold by
Secretary Of Hud
Bought by
Coots Gary
Purchase Details
Closed on
Aug 29, 2000
Sold by
S & W Construction
Bought by
Phillips Robert
Home Financials for this Owner
Home Financials are based on the most recent Mortgage that was taken out on this home.
Original Mortgage
$106,735
Interest Rate
8.24%
Mortgage Type
FHA
Create a Home Valuation Report for This Property
The Home Valuation Report is an in-depth analysis detailing your home's value as well as a comparison with similar homes in the area
Home Values in the Area
Average Home Value in this Area
Purchase History
| Date | Buyer | Sale Price | Title Company |
|---|---|---|---|
| Lee Tracey L | -- | -- | |
| Lee Tracey L | -- | -- | |
| Lee-Jones Tracey L | $128,700 | -- | |
| Coots Gary | -- | -- | |
| Phillips Robert | $108,200 | -- |
Source: Public Records
Mortgage History
| Date | Status | Borrower | Loan Amount |
|---|---|---|---|
| Previous Owner | Lee-Jones Tracey L | $127,646 | |
| Previous Owner | Phillips Robert | $106,735 |
Source: Public Records
Tax History Compared to Growth
Tax History
| Year | Tax Paid | Tax Assessment Tax Assessment Total Assessment is a certain percentage of the fair market value that is determined by local assessors to be the total taxable value of land and additions on the property. | Land | Improvement |
|---|---|---|---|---|
| 2024 | $2,625 | $107,480 | $16,000 | $91,480 |
| 2023 | $2,468 | $94,840 | $7,200 | $87,640 |
| 2022 | $1,985 | $77,040 | $7,200 | $69,840 |
| 2021 | $1,662 | $58,680 | $7,200 | $51,480 |
| 2020 | $1,561 | $50,360 | $7,200 | $43,160 |
| 2019 | $1,462 | $46,760 | $7,200 | $39,560 |
| 2018 | $1,415 | $45,120 | $7,200 | $37,920 |
| 2017 | $1,260 | $40,600 | $6,400 | $34,200 |
| 2016 | $812 | $27,560 | $4,000 | $23,560 |
| 2015 | $848 | $28,600 | $3,400 | $25,200 |
| 2014 | $725 | $25,040 | $0 | $0 |
Source: Public Records
Map
Nearby Homes
- 220 McGiboney Place
- 145 McGiboney Place
- 75 Fox Chase
- 165 Randy Trace
- 115 Randy Trace
- 15 Lisa Ct
- 60 Knights Cir
- 510 Stonecreek Ln Unit 56
- 250 Stonecreek Pkwy
- 140 Sunflower Ln
- 75 Trelawney Keep Unit 9
- 5798 Salem Rd
- 11889 Brown Bridge Rd
- 230 Lynn Dr
- 400 Oak Hill Dr
- 75 Havenwood Ln
- 0 Eleanor Dr Unit 10443925
- 40 Cindy Cir
- 265 Claremont Dr Unit 2
- 235 Claremont Dr Unit 2
- 260 Claremont Dr
- 275 Claremont Dr Unit 2
- 240 Claremont Dr Unit 2
- 205 Claremont Dr Unit 2
- 270 Claremont Dr Unit 2
- 230 Claremont Dr
- 285 Claremont Dr Unit 2
- 220 Claremont Dr Unit 2
- 280 Claremont Dr Unit 2
- 20 Serena Ct
- 30 Serena Ct
- 195 Claremont Dr Unit 2
- 195 Claremont Dr
- 40 Serena Ct
- 295 Claremont Dr
- 295 Claremont Dr Unit 2
- 210 Claremont Dr
- 290 Claremont Dr Unit 2