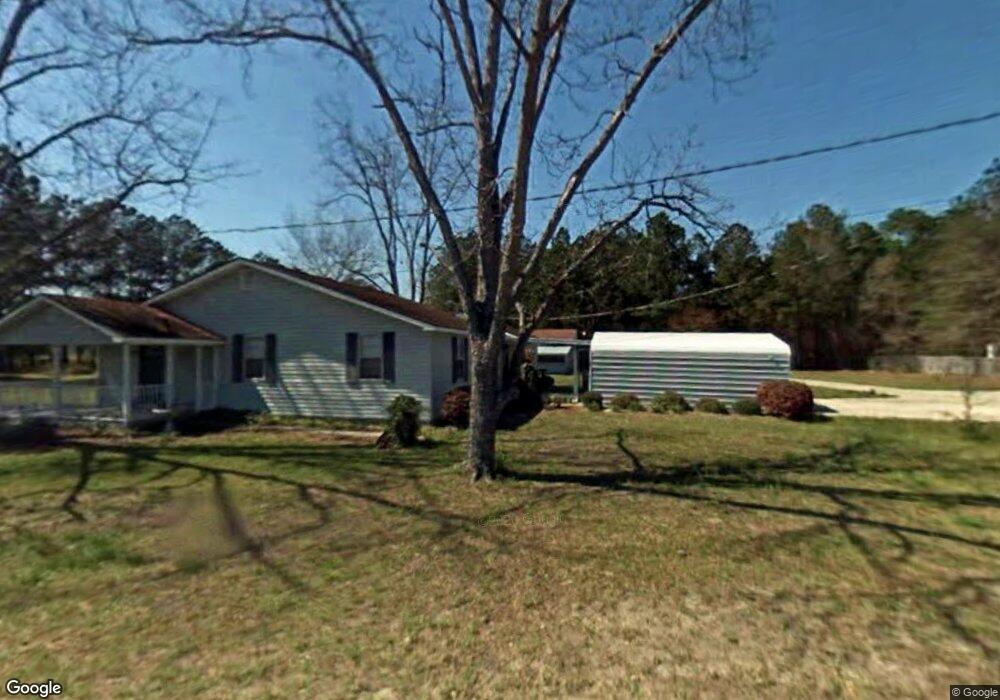
255 Driggers Ln Waycross, GA 31503
Estimated Value: $193,632 - $247,000
3
Beds
2
Baths
1,768
Sq Ft
$123/Sq Ft
Est. Value
About This Home
This home is located at 255 Driggers Ln, Waycross, GA 31503 and is currently estimated at $217,908, approximately $123 per square foot. 255 Driggers Ln is a home located in Ware County with nearby schools including Memorial Drive Elementary School, Waycross Middle School, and Ware County High School.
Ownership History
Date
Name
Owned For
Owner Type
Purchase Details
Closed on
Mar 27, 2014
Sold by
Mccorvey Kristopher Kodi
Bought by
Lee Jessica Lindsey and Lee David Paul
Current Estimated Value
Home Financials for this Owner
Home Financials are based on the most recent Mortgage that was taken out on this home.
Original Mortgage
$87,289
Outstanding Balance
$66,754
Interest Rate
4.5%
Mortgage Type
FHA
Estimated Equity
$151,154
Purchase Details
Closed on
Sep 29, 2005
Sold by
Mccorvey Brenda S
Bought by
Mccorvey K Kodi
Home Financials for this Owner
Home Financials are based on the most recent Mortgage that was taken out on this home.
Original Mortgage
$84,600
Interest Rate
5.66%
Mortgage Type
New Conventional
Purchase Details
Closed on
Mar 29, 2002
Sold by
Mccorvey Keith and Mccorvey Bre
Bought by
Mccorvey Brenda
Purchase Details
Closed on
Jul 25, 1991
Bought by
Mccorvey Keith and Mccorvey Bre
Purchase Details
Closed on
Jun 4, 1991
Bought by
1St Rr Community Fed
Purchase Details
Closed on
May 25, 1989
Bought by
Cox Ruby
Create a Home Valuation Report for This Property
The Home Valuation Report is an in-depth analysis detailing your home's value as well as a comparison with similar homes in the area
Home Values in the Area
Average Home Value in this Area
Purchase History
| Date | Buyer | Sale Price | Title Company |
|---|---|---|---|
| Lee Jessica Lindsey | $88,900 | -- | |
| Mccorvey K Kodi | $94,000 | -- | |
| Mccorvey Brenda | -- | -- | |
| Mccorvey Keith | $25,000 | -- | |
| 1St Rr Community Fed | $25,500 | -- | |
| Cox Ruby | -- | -- |
Source: Public Records
Mortgage History
| Date | Status | Borrower | Loan Amount |
|---|---|---|---|
| Open | Lee Jessica Lindsey | $87,289 | |
| Previous Owner | Mccorvey K Kodi | $84,600 |
Source: Public Records
Tax History Compared to Growth
Tax History
| Year | Tax Paid | Tax Assessment Tax Assessment Total Assessment is a certain percentage of the fair market value that is determined by local assessors to be the total taxable value of land and additions on the property. | Land | Improvement |
|---|---|---|---|---|
| 2024 | $1,818 | $66,493 | $4,652 | $61,841 |
| 2023 | $1,711 | $42,406 | $1,980 | $40,426 |
| 2022 | $1,224 | $42,406 | $1,980 | $40,426 |
| 2021 | $1,108 | $35,323 | $1,980 | $33,343 |
| 2020 | $1,091 | $34,409 | $1,980 | $32,429 |
| 2019 | $1,113 | $34,409 | $1,980 | $32,429 |
| 2018 | $1,093 | $33,495 | $1,980 | $31,515 |
| 2017 | $854 | $33,495 | $1,980 | $31,515 |
| 2016 | $854 | $26,184 | $1,980 | $24,204 |
| 2015 | $882 | $26,815 | $1,980 | $24,835 |
| 2014 | $816 | $26,815 | $1,980 | $24,835 |
| 2013 | -- | $26,815 | $1,980 | $24,835 |
Source: Public Records
Map
Nearby Homes
- 3153 Southwood Dr
- 291 Sawdust Trail
- 763 Kentland Dr
- 3070 Central Ave
- 723 St Bernard Trail
- 867 Kentland Dr
- 0 Brunswick Hwy Unit 1648370
- 3817 Central Ave
- 2775 Seminole Trail
- 4337 White Hall Church Rd
- 4337 Whitehall Church Rd
- 1132 Hilltop Rd
- 606 Stonewall Jackson Place
- 664 Saddle Cir
- 1049 Riverdale Dr
- 630 Saddle Cir
- 627 Saddle Cir
- 955 Lynn Dr
- Tract 4 County-Line Rd S
- 851 Carriage Ln
- 225 Driggers Ln
- 230 Driggers Ln
- 238 Tomberlin Rd
- 310 Driggers Ln
- 00 Driggers Ln
- 0 Driggers Ln
- 164 Tomberlin Rd
- 345 Driggers Ln
- 346 Driggers Ln
- 346 Driggers Ln
- 3353 Knight Ave
- 360 Driggers Ln
- 122 Tomberlin Rd
- 3247 Knight Ave
- 300 Tomberlin Rd
- 386 Driggers Ln
- 330 Driggers Ln
- 0 Brunswick Hy
- 3131 Bethany Ln
- 406 Driggers Ln