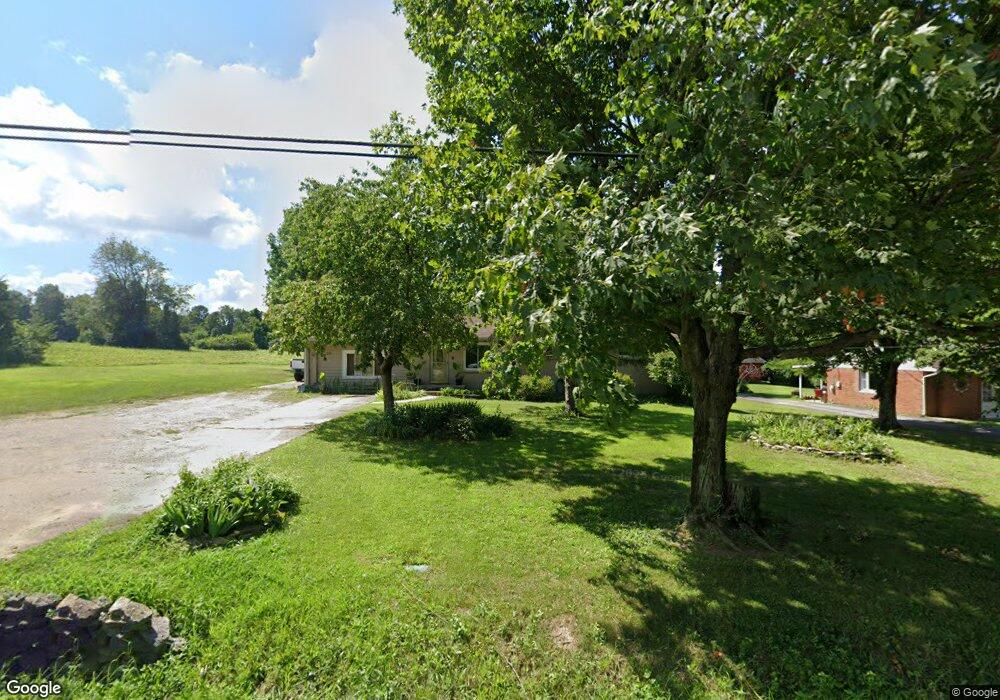
255 E Lytle 5 Points Rd Dayton, OH 45458
Estimated Value: $268,000 - $295,240
3
Beds
2
Baths
1,550
Sq Ft
$181/Sq Ft
Est. Value
About This Home
This home is located at 255 E Lytle 5 Points Rd, Dayton, OH 45458 and is currently estimated at $281,310, approximately $181 per square foot. 255 E Lytle 5 Points Rd is a home located in Warren County with nearby schools including Clearcreek Elementary School, Springboro Intermediate School, and Springboro Junior High School.
Ownership History
Date
Name
Owned For
Owner Type
Purchase Details
Closed on
Mar 28, 2022
Sold by
Phillip Lunsford
Bought by
Lunsford Phillip and Lunsford Belenda
Current Estimated Value
Purchase Details
Closed on
Dec 23, 2005
Sold by
Meenach Virgil Ray and Meenach Katherine
Bought by
Lunsford Phillip
Home Financials for this Owner
Home Financials are based on the most recent Mortgage that was taken out on this home.
Original Mortgage
$119,900
Interest Rate
6.48%
Mortgage Type
Fannie Mae Freddie Mac
Purchase Details
Closed on
Apr 12, 1994
Sold by
Meenach Virgil Ray and Meenach Pen
Bought by
Meenach and Virgil Ray
Create a Home Valuation Report for This Property
The Home Valuation Report is an in-depth analysis detailing your home's value as well as a comparison with similar homes in the area
Home Values in the Area
Average Home Value in this Area
Purchase History
| Date | Buyer | Sale Price | Title Company |
|---|---|---|---|
| Lunsford Phillip | -- | None Listed On Document | |
| Lunsford Phillip | $149,900 | Heritage Land Title Llc | |
| Meenach | -- | -- |
Source: Public Records
Mortgage History
| Date | Status | Borrower | Loan Amount |
|---|---|---|---|
| Previous Owner | Lunsford Phillip | $119,900 |
Source: Public Records
Tax History
| Year | Tax Paid | Tax Assessment Tax Assessment Total Assessment is a certain percentage of the fair market value that is determined by local assessors to be the total taxable value of land and additions on the property. | Land | Improvement |
|---|---|---|---|---|
| 2024 | $3,132 | $76,700 | $21,210 | $55,490 |
| 2023 | $2,721 | $61,141 | $11,861 | $49,280 |
| 2022 | $2,660 | $61,142 | $11,862 | $49,280 |
| 2021 | $2,504 | $61,142 | $11,862 | $49,280 |
| 2020 | $2,353 | $49,707 | $9,643 | $40,065 |
| 2019 | $2,181 | $49,707 | $9,643 | $40,065 |
Source: Public Records
Map
Nearby Homes
- 9048 Thornhill Ct
- 9229 Bennington Way
- 9079 Bunnell Hill Rd
- 9048 Bedford Ct
- 9354 Remington Hill Rd
- 9175 Bunnell Hill Rd
- 9195 Glenridge Blvd
- 9279 Maxwells Crossing
- 9378 Remington Hill Rd
- 22 Patton Dr
- 251 Fallen Leaf Ct
- 8670 Hawthorne Place
- 404 Belleclaire Hill
- 50 Bentbrook Ct
- 15 Pembrook Dr
- 9751 Scotch Pine Dr
- 8301 Red Lion 5 Points Rd
- 0 White Cedar Way Unit 1818661
- 9161 Remy Ct
- 9101 Remy Ct
- 243 E Lytle 5 Points Rd
- 243 E Lytle Five Points Rd
- 223 E Lytle 5 Points Rd
- 8718 Highmount Dr
- 9032 Highland Cir
- 9036 Highland Cir
- 9035 Highland Cir
- 331 E Lytle 5 Points Rd
- 175 E Lytle 5 Points Rd
- 8716 Highmount Dr
- 9042 Highland Cir
- 9034 Thornhill Ct
- 8715 Highmount Dr
- 9043 Highland Cir
- 9048 Highland Cir
- 9030 Thornhill Ct
- 362 Hillcrest Dr
- 9049 Highland Cir
- 8704 Highmount Dr
- 159 E Lytle 5 Points Rd