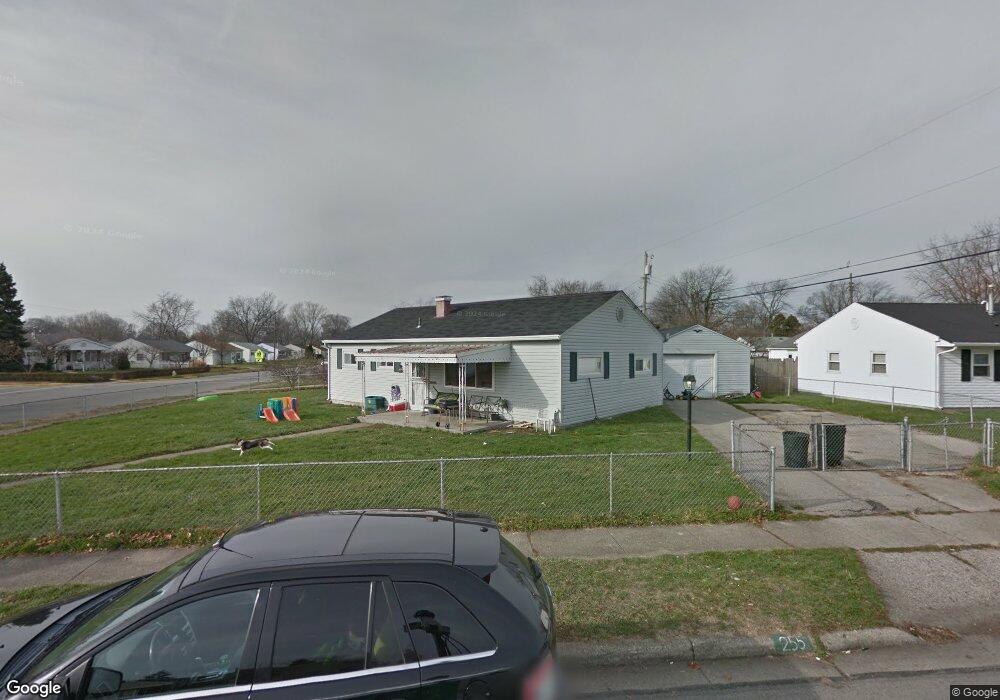
255 Florence Ave Fairborn, OH 45324
Estimated Value: $138,000 - $160,000
3
Beds
1
Bath
960
Sq Ft
$157/Sq Ft
Est. Value
About This Home
This home is located at 255 Florence Ave, Fairborn, OH 45324 and is currently estimated at $150,265, approximately $156 per square foot. 255 Florence Ave is a home located in Greene County with nearby schools including Fairborn Primary School, Fairborn Intermediate School, and Fairborn Middle School.
Ownership History
Date
Name
Owned For
Owner Type
Purchase Details
Closed on
Aug 23, 2007
Sold by
Us Bank Na Nd
Bought by
York Steven R and York Darlene M
Current Estimated Value
Purchase Details
Closed on
Nov 18, 2006
Sold by
Atkinson Gary A and Atkinson Deanna L
Bought by
Us Bank Na Nd
Purchase Details
Closed on
Aug 25, 2003
Sold by
Atkinson Deanna L and Atkinson Gary A
Bought by
Atkinson Gary A and Atkinson Deanna L
Home Financials for this Owner
Home Financials are based on the most recent Mortgage that was taken out on this home.
Original Mortgage
$75,100
Interest Rate
6.18%
Mortgage Type
VA
Purchase Details
Closed on
Jul 30, 1999
Sold by
Rouch Barbara J and Rouch Laurak
Bought by
Atkinson Deanna L
Home Financials for this Owner
Home Financials are based on the most recent Mortgage that was taken out on this home.
Original Mortgage
$74,970
Interest Rate
7.77%
Mortgage Type
VA
Create a Home Valuation Report for This Property
The Home Valuation Report is an in-depth analysis detailing your home's value as well as a comparison with similar homes in the area
Home Values in the Area
Average Home Value in this Area
Purchase History
| Date | Buyer | Sale Price | Title Company |
|---|---|---|---|
| York Steven R | $54,000 | Resource Title Agency Inc | |
| Us Bank Na Nd | -- | Attorney | |
| Atkinson Gary A | -- | -- | |
| Atkinson Deanna L | $73,500 | -- |
Source: Public Records
Mortgage History
| Date | Status | Borrower | Loan Amount |
|---|---|---|---|
| Previous Owner | Atkinson Gary A | $75,100 | |
| Previous Owner | Atkinson Deanna L | $74,970 |
Source: Public Records
Tax History Compared to Growth
Tax History
| Year | Tax Paid | Tax Assessment Tax Assessment Total Assessment is a certain percentage of the fair market value that is determined by local assessors to be the total taxable value of land and additions on the property. | Land | Improvement |
|---|---|---|---|---|
| 2024 | $1,794 | $35,680 | $9,250 | $26,430 |
| 2023 | $1,709 | $35,680 | $9,250 | $26,430 |
| 2022 | $1,312 | $23,070 | $6,610 | $16,460 |
| 2021 | $2,315 | $23,070 | $6,610 | $16,460 |
| 2020 | $3,076 | $23,070 | $6,610 | $16,460 |
| 2019 | $2,861 | $19,660 | $5,870 | $13,790 |
| 2018 | $1,152 | $19,660 | $5,870 | $13,790 |
| 2017 | $894 | $19,660 | $5,870 | $13,790 |
| 2016 | $1,151 | $19,640 | $5,870 | $13,770 |
| 2015 | $4,870 | $19,640 | $5,870 | $13,770 |
| 2014 | $9,582 | $19,640 | $5,870 | $13,770 |
Source: Public Records
Map
Nearby Homes
- 3 Holgate Ct
- 5 Marchmont Dr
- 20 Ramona Dr
- 869 S Maple Ave
- 97 Marchmont Dr
- 849 S Maple Ave
- 849 Flintridge Dr
- 43 Lindway Dr
- 852 Princeton Ave
- 849 Princeton Ave
- 44 Brockway Ct
- 1108 Lexington Ave
- 860 Washington Ave
- 1121 Lexington Ave
- 608 S Maple Ave
- 1040 S Central Ave
- 322 Shade Dr
- 493 Florence Ave
- 1033 Victoria Ave
- 66 S Central Ave
- 91 Redbank Dr
- 247 Florence Ave
- 241 Florence Ave
- 2 Holgate Ct
- 252 Florence Ave
- 6 Holgate Ct
- 96 Redbank Dr
- 101 Redbank Dr
- 246 Florence Ave
- 8 Holgate Ct
- 235 Florence Ave
- 240 Florence Ave
- 106 Redbank Dr
- 107 Redbank Dr
- 90 Redbank Dr
- 16 Dellwood Dr
- 234 Florence Ave
- 229 Florence Ave
- 201 Redbank Dr
- 82 Redbank Dr