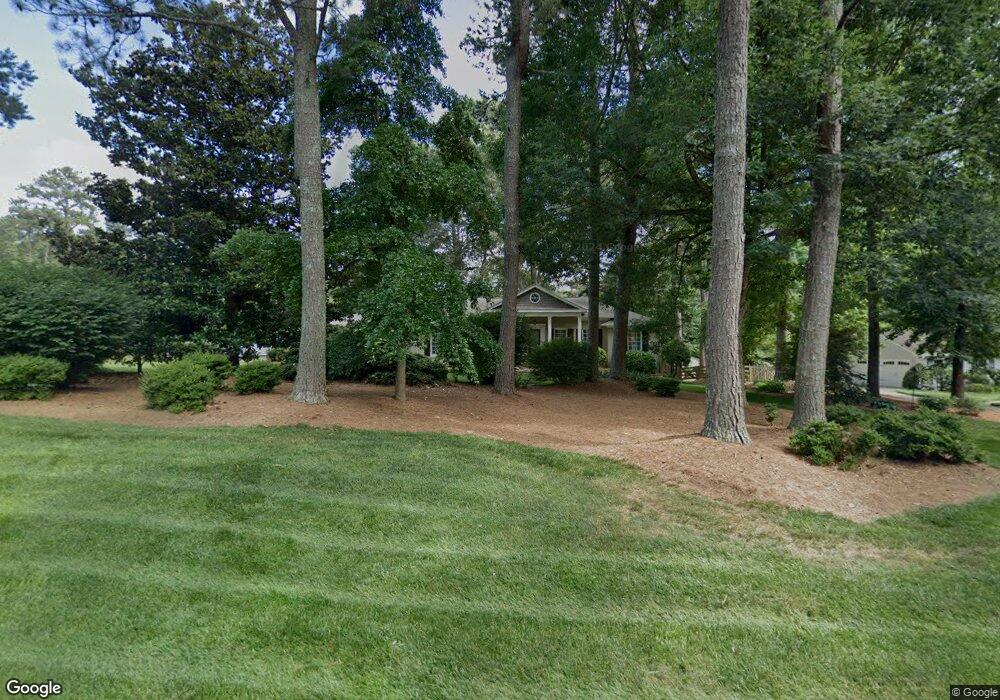
255 Hembree Rd Unit 1 Roswell, GA 30075
Estimated Value: $616,000 - $705,144
4
Beds
3
Baths
1,806
Sq Ft
$364/Sq Ft
Est. Value
About This Home
This home is located at 255 Hembree Rd Unit 1, Roswell, GA 30075 and is currently estimated at $658,286, approximately $364 per square foot. 255 Hembree Rd Unit 1 is a home located in Fulton County with nearby schools including Sweet Apple Elementary School, Elkins Pointe Middle School, and Fulton Academy of Science and Technology.
Ownership History
Date
Name
Owned For
Owner Type
Purchase Details
Closed on
Nov 10, 2011
Sold by
French Robert P
Bought by
French Robert P and French Susan
Current Estimated Value
Home Financials for this Owner
Home Financials are based on the most recent Mortgage that was taken out on this home.
Original Mortgage
$331,870
Outstanding Balance
$227,936
Interest Rate
4.17%
Mortgage Type
New Conventional
Estimated Equity
$430,350
Purchase Details
Closed on
May 11, 2001
Sold by
Livingston Lynda L and Livingston Cary S
Bought by
French Robert P and French Susan M
Home Financials for this Owner
Home Financials are based on the most recent Mortgage that was taken out on this home.
Original Mortgage
$212,400
Interest Rate
7.05%
Mortgage Type
New Conventional
Purchase Details
Closed on
Jan 6, 1994
Sold by
Martin Paul V Carol J
Bought by
Livingston Lynda L Cary S
Home Financials for this Owner
Home Financials are based on the most recent Mortgage that was taken out on this home.
Original Mortgage
$134,900
Interest Rate
7.1%
Create a Home Valuation Report for This Property
The Home Valuation Report is an in-depth analysis detailing your home's value as well as a comparison with similar homes in the area
Home Values in the Area
Average Home Value in this Area
Purchase History
| Date | Buyer | Sale Price | Title Company |
|---|---|---|---|
| French Robert P | -- | -- | |
| French Robert P | $236,000 | -- | |
| Livingston Lynda L Cary S | $142,000 | -- |
Source: Public Records
Mortgage History
| Date | Status | Borrower | Loan Amount |
|---|---|---|---|
| Open | French Robert P | $331,870 | |
| Previous Owner | French Robert P | $212,400 | |
| Previous Owner | Livingston Lynda L Cary S | $134,900 |
Source: Public Records
Tax History Compared to Growth
Tax History
| Year | Tax Paid | Tax Assessment Tax Assessment Total Assessment is a certain percentage of the fair market value that is determined by local assessors to be the total taxable value of land and additions on the property. | Land | Improvement |
|---|---|---|---|---|
| 2025 | $794 | $247,720 | $66,720 | $181,000 |
| 2023 | $7,374 | $261,240 | $82,920 | $178,320 |
| 2022 | $3,028 | $209,640 | $56,920 | $152,720 |
| 2021 | $3,594 | $181,320 | $40,000 | $141,320 |
| 2020 | $3,639 | $152,360 | $36,400 | $115,960 |
| 2019 | $595 | $149,640 | $35,760 | $113,880 |
| 2018 | $3,478 | $146,160 | $34,920 | $111,240 |
| 2017 | $2,967 | $113,640 | $22,240 | $91,400 |
| 2016 | $2,952 | $113,640 | $22,240 | $91,400 |
| 2015 | $3,582 | $113,640 | $22,240 | $91,400 |
| 2014 | $2,534 | $95,400 | $18,680 | $76,720 |
Source: Public Records
Map
Nearby Homes
- 345 Chaffin Ridge Ct
- 11850 Chaffin Rd
- 5022 Towneship Creek Rd
- 1000 Sterling Ct
- 5000 Lexington Dr
- 120 Gala Ct
- 1012 Towneship Way
- 1002 Towneship Way
- 600 Rounsaville Rd
- 220 Hollyberry Ct
- 220 Hollyberry Dr
- 515 Wavetree Dr
- 115 Great Oaks Ln
- 110 Great Oaks Ln
- 6010 Claiborne Cove
- 1515 Elgaen Place Dr
- 178 Victoria Way
- 210 Devereux Downs
- 245 Hembree Rd
- 100 Northgate Ct
- 265 Hembree Rd
- 240 Hembree Rd
- 235 Hembree Rd
- 110 Northgate Ct Unit 1
- 234 Hembree Rd Unit 234
- 275 Hembree Rd
- 105 Northgate Ct
- 230 Hembree Rd
- 11560 11560 Northgate Trail
- 11560 Northgate Trail
- 120 Northgate Ct
- 11545 Northgate Way
- 260 Hembree Rd Unit 1
- 225 Hembree Rd
- 285 Hembree Rd
- 11555 Northgate Way
- 115 Northgate Ct
- 11565 Northgate Trail Unit 2