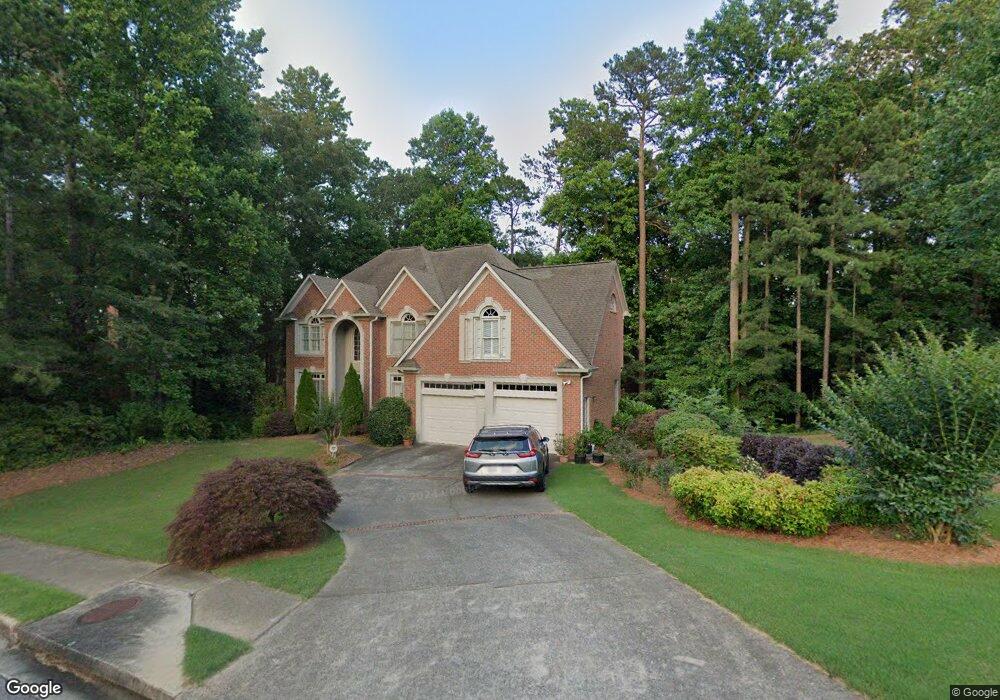
255 High Branch Way Unit 6B Roswell, GA 30075
Estimated Value: $852,000 - $984,000
5
Beds
4
Baths
3,152
Sq Ft
$288/Sq Ft
Est. Value
About This Home
This home is located at 255 High Branch Way Unit 6B, Roswell, GA 30075 and is currently estimated at $908,078, approximately $288 per square foot. 255 High Branch Way Unit 6B is a home located in Fulton County with nearby schools including Roswell North Elementary School, Crabapple Middle School, and St Francis Day School.
Ownership History
Date
Name
Owned For
Owner Type
Purchase Details
Closed on
Dec 6, 2019
Sold by
Raflee Mohammad
Bought by
Rafiee Mehrdad
Current Estimated Value
Purchase Details
Closed on
Mar 10, 2005
Sold by
Pilger Carlton C and Pilger Lisa
Bought by
Rafiee Mohammad
Home Financials for this Owner
Home Financials are based on the most recent Mortgage that was taken out on this home.
Original Mortgage
$287,000
Interest Rate
5.6%
Mortgage Type
New Conventional
Purchase Details
Closed on
Mar 30, 1998
Sold by
Tucker Stephen B
Bought by
Pilger Carlton C and Pilger Lisa M
Home Financials for this Owner
Home Financials are based on the most recent Mortgage that was taken out on this home.
Original Mortgage
$310,150
Interest Rate
7.09%
Mortgage Type
New Conventional
Purchase Details
Closed on
Dec 29, 1995
Sold by
John Wieland Homes Inc
Bought by
Tucker Stephen B
Create a Home Valuation Report for This Property
The Home Valuation Report is an in-depth analysis detailing your home's value as well as a comparison with similar homes in the area
Home Values in the Area
Average Home Value in this Area
Purchase History
| Date | Buyer | Sale Price | Title Company |
|---|---|---|---|
| Rafiee Mehrdad | -- | -- | |
| Rafiee Mohammad | $410,000 | -- | |
| Pilger Carlton C | $326,500 | -- | |
| Tucker Stephen B | $319,900 | -- |
Source: Public Records
Mortgage History
| Date | Status | Borrower | Loan Amount |
|---|---|---|---|
| Previous Owner | Rafiee Mohammad | $287,000 | |
| Previous Owner | Pilger Carlton C | $310,150 | |
| Closed | Tucker Stephen B | $0 |
Source: Public Records
Tax History Compared to Growth
Tax History
| Year | Tax Paid | Tax Assessment Tax Assessment Total Assessment is a certain percentage of the fair market value that is determined by local assessors to be the total taxable value of land and additions on the property. | Land | Improvement |
|---|---|---|---|---|
| 2025 | $1,164 | $285,160 | $61,680 | $223,480 |
| 2023 | $8,398 | $297,520 | $92,560 | $204,960 |
| 2022 | $5,200 | $261,480 | $51,920 | $209,560 |
| 2021 | $6,201 | $245,440 | $47,240 | $198,200 |
| 2020 | $6,286 | $236,440 | $40,000 | $196,440 |
| 2019 | $1,048 | $232,240 | $39,280 | $192,960 |
| 2018 | $5,813 | $226,800 | $38,360 | $188,440 |
| 2017 | $5,506 | $201,920 | $32,160 | $169,760 |
| 2016 | $5,480 | $201,920 | $32,160 | $169,760 |
| 2015 | $6,602 | $201,920 | $32,160 | $169,760 |
| 2014 | $4,841 | $170,680 | $27,200 | $143,480 |
Source: Public Records
Map
Nearby Homes
- 220 High Branch Way
- 3245 Bywater Trail Unit 6B
- 1731 E Bank Dr
- 2039 Old Forge Way
- 5617 Asheforde Ln
- 1009 Lake Pointe Cir
- The Carrington Plan at Hillandale in Historic Roswell
- The Rocklyn Plan at Hillandale in Historic Roswell
- The Grafton Plan at Hillandale in Historic Roswell
- The Greighton Plan at Hillandale in Historic Roswell
- 4035 Connolly Ct
- 3210 Lake Pointe Cir
- 355 Highlands Trace
- 3113 Lake Pointe Cir
- 4013 Lake Pointe Cir Unit 4013
- 5150 Timber Ridge Rd
- 2255 Rushmore Dr
- 9035 Sandorn Dr
- 5140 Timber Ridge Rd
- 265 High Branch Way
- 245 High Branch Way Unit 6A
- 250 High Branch Way Unit 6B
- 275 High Branch Way Unit 6B
- 240 High Branch Way
- 260 High Branch Way
- 285 High Branch Way Unit 6B
- 3175 Bywater Trail
- 3185 Bywater Trail Unit 6B
- 3165 Bywater Trail
- 270 High Branch Way
- 235 High Branch Way
- 295 High Branch Way
- 105 Longwater Cove Unit 6A
- 225 High Branch Way Unit 6A
- 3195 Bywater Trail
- 110 Longwater Cove
- 280 High Branch Way
- 3205 Bywater Trail Unit 6B
- 3180 Bywater Trail