Estimated Value: $235,078 - $293,000
3
Beds
2
Baths
1,298
Sq Ft
$203/Sq Ft
Est. Value
About This Home
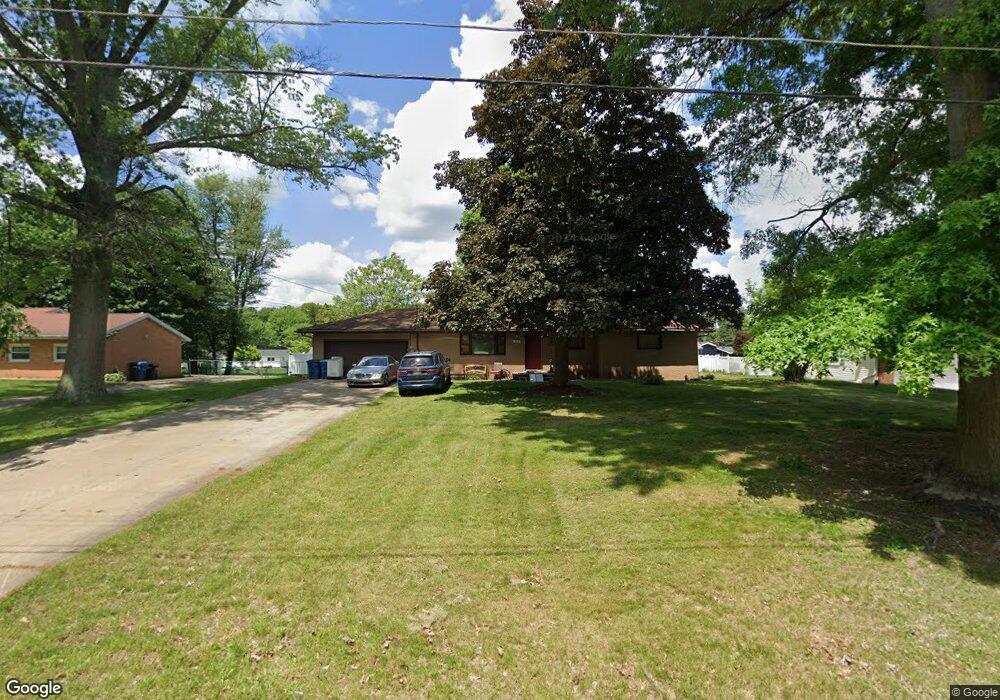
This home is located at 255 Magua Dr, Akron, OH 44319 and is currently estimated at $263,020, approximately $202 per square foot. 255 Magua Dr is a home located in Summit County with nearby schools including Greenwood Elementary School, Green Intermediate Elementary School, and Green Primary School.
Ownership History
Date
Name
Owned For
Owner Type
Purchase Details
Closed on
Sep 21, 2017
Sold by
Vance Tara Lyn
Bought by
Vance John and Vance Patricia
Current Estimated Value
Home Financials for this Owner
Home Financials are based on the most recent Mortgage that was taken out on this home.
Original Mortgage
$92,000
Outstanding Balance
$76,827
Interest Rate
3.9%
Mortgage Type
New Conventional
Estimated Equity
$186,193
Purchase Details
Closed on
Dec 13, 2011
Sold by
Rayl Timothy J
Bought by
Vance Tara Lyn
Home Financials for this Owner
Home Financials are based on the most recent Mortgage that was taken out on this home.
Original Mortgage
$108,800
Interest Rate
4.02%
Mortgage Type
New Conventional
Purchase Details
Closed on
Mar 18, 2002
Sold by
Rayl Deborah D
Bought by
Rayl Timothy J
Purchase Details
Closed on
May 3, 1999
Sold by
Carney Pauline F and Carney Pauline
Bought by
Rayl Deborah and Rayl Timothy J
Create a Home Valuation Report for This Property
The Home Valuation Report is an in-depth analysis detailing your home's value as well as a comparison with similar homes in the area
Purchase History
| Date | Buyer | Sale Price | Title Company |
|---|---|---|---|
| Vance John | $165,000 | None Available | |
| Vance Tara Lyn | -- | Attorney | |
| Rayl Timothy J | -- | -- | |
| Rayl Deborah | $122,500 | Midland Commerce Group |
Source: Public Records
Mortgage History
| Date | Status | Borrower | Loan Amount |
|---|---|---|---|
| Open | Vance John | $92,000 | |
| Closed | Vance Tara Lyn | $108,800 |
Source: Public Records
Tax History
| Year | Tax Paid | Tax Assessment Tax Assessment Total Assessment is a certain percentage of the fair market value that is determined by local assessors to be the total taxable value of land and additions on the property. | Land | Improvement |
|---|---|---|---|---|
| 2024 | $3,552 | $71,386 | $11,977 | $59,409 |
| 2023 | $3,552 | $71,386 | $11,977 | $59,409 |
| 2022 | $3,018 | $54,236 | $9,072 | $45,164 |
| 2021 | $2,767 | $54,236 | $9,072 | $45,164 |
| 2020 | $2,814 | $54,230 | $9,070 | $45,160 |
| 2019 | $2,338 | $42,220 | $9,070 | $33,150 |
| 2018 | $2,389 | $42,220 | $9,070 | $33,150 |
| 2017 | $2,402 | $42,220 | $9,070 | $33,150 |
| 2016 | $2,362 | $42,220 | $9,070 | $33,150 |
| 2015 | $2,402 | $42,220 | $9,070 | $33,150 |
| 2014 | $2,385 | $42,220 | $9,070 | $33,150 |
| 2013 | $2,548 | $44,920 | $9,070 | $35,850 |
Source: Public Records
Map
Nearby Homes
- 397 Wonder Lake Dr
- 3785 S Main St
- 308 E Vista Ave
- 619 Moore Rd
- 68 Starboard Cir
- 4138 S Main St
- 3273 S Jasmine Ave
- 570 E Turkeyfoot Lake Rd
- 76 Forest Mill Ln
- 221 Lake Front Dr
- 4298 S Main St Unit 4302
- 277 Lake Front Dr
- 3809 N Glenridge Rd
- 222 Olden Ave
- 3812 N Glenridge Rd
- 265 E Pace Ave
- 3085 Daisy Ave
- 4135 State Park Dr
- 347 Dorwil Dr
- 0 Fortuna Dr Unit 5005346
- 245 Magua Dr
- 267 Magua Dr
- 3670 Cottage Grove Rd
- 235 Magua Dr
- 260 Magua Dr
- 3660 Cottage Grove Rd
- 250 Magua Dr
- 240 Moore Rd
- 270 Magua Dr
- 3735 Cayugas Dr
- 225 Magua Dr
- 230 Moore Rd
- 287 Bonshire Rd
- 310 Bonshire Rd
- 3669 Cottage Grove Rd
- 260 Moore Rd
- 220 Moore Rd
- 3699 Cottage Grove Rd
- 215 Magua Dr
- 3732 Cayugas Dr
Your Personal Tour Guide
Ask me questions while you tour the home.