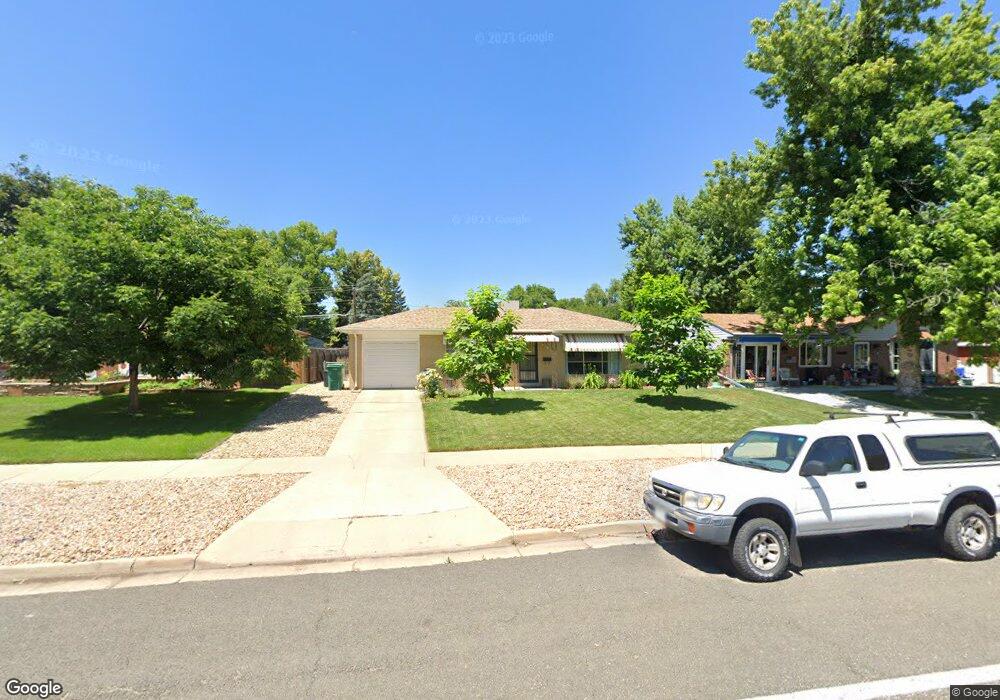
255 Main St Broomfield, CO 80020
Broomfield Heights NeighborhoodEstimated Value: $473,650 - $511,000
3
Beds
2
Baths
1,220
Sq Ft
$408/Sq Ft
Est. Value
About This Home
This home is located at 255 Main St, Broomfield, CO 80020 and is currently estimated at $497,217, approximately $407 per square foot. 255 Main St is a home located in Broomfield County with nearby schools including Broomfield Heights Middle School, Broomfield High School, and Jefferson Academy Secondary School.
Ownership History
Date
Name
Owned For
Owner Type
Purchase Details
Closed on
Feb 28, 2015
Sold by
Sigley Mark W and Brown Mary A
Bought by
Sigley Mark W and Sigley Julie
Current Estimated Value
Purchase Details
Closed on
Jan 30, 2014
Sold by
Sigley Mark W and Brown Mary A
Bought by
Sigley Mark W and Brown Mary A
Purchase Details
Closed on
Jun 12, 2001
Purchase Details
Closed on
Nov 13, 1998
Purchase Details
Closed on
Nov 12, 1986
Purchase Details
Closed on
Aug 18, 1986
Create a Home Valuation Report for This Property
The Home Valuation Report is an in-depth analysis detailing your home's value as well as a comparison with similar homes in the area
Home Values in the Area
Average Home Value in this Area
Purchase History
| Date | Buyer | Sale Price | Title Company |
|---|---|---|---|
| Sigley Mark W | -- | None Available | |
| Sigley Mark W | -- | None Available | |
| -- | -- | -- | |
| -- | -- | -- | |
| -- | -- | -- | |
| -- | -- | -- |
Source: Public Records
Tax History Compared to Growth
Tax History
| Year | Tax Paid | Tax Assessment Tax Assessment Total Assessment is a certain percentage of the fair market value that is determined by local assessors to be the total taxable value of land and additions on the property. | Land | Improvement |
|---|---|---|---|---|
| 2025 | $2,542 | $28,420 | $8,140 | $20,280 |
| 2024 | $2,542 | $27,130 | $7,560 | $19,570 |
| 2023 | $2,537 | $31,960 | $8,910 | $23,050 |
| 2022 | $2,146 | $22,200 | $5,740 | $16,460 |
| 2021 | $2,135 | $22,840 | $5,910 | $16,930 |
| 2020 | $1,995 | $21,210 | $5,290 | $15,920 |
| 2019 | $1,992 | $21,350 | $5,320 | $16,030 |
| 2018 | $1,641 | $17,380 | $3,890 | $13,490 |
| 2017 | $1,616 | $19,220 | $4,300 | $14,920 |
| 2016 | $1,419 | $15,050 | $4,300 | $10,750 |
| 2015 | $1,370 | $12,600 | $4,550 | $8,050 |
| 2014 | $1,173 | $12,600 | $4,550 | $8,050 |
Source: Public Records
Map
Nearby Homes
- 255 Beryl Way
- 126 Beryl Way
- 290 Daphne Way
- 400 W Midway Blvd
- 123 Emerald St
- 240 W 6th Ave
- 216 Hemlock St
- 55 Emerald St
- 375 Hemlock St
- 135 Garnet St
- 690 W 1st Ave
- 1 Evergreen St
- 820 W 7th Avenue Dr
- 6801 W 118th Ave
- 920 W 1st Ave
- 1179 Highland Park Dr
- 640 Kalmia Way
- 680 Kalmia Way
- 125 Laurel St
- 405 Cypress St