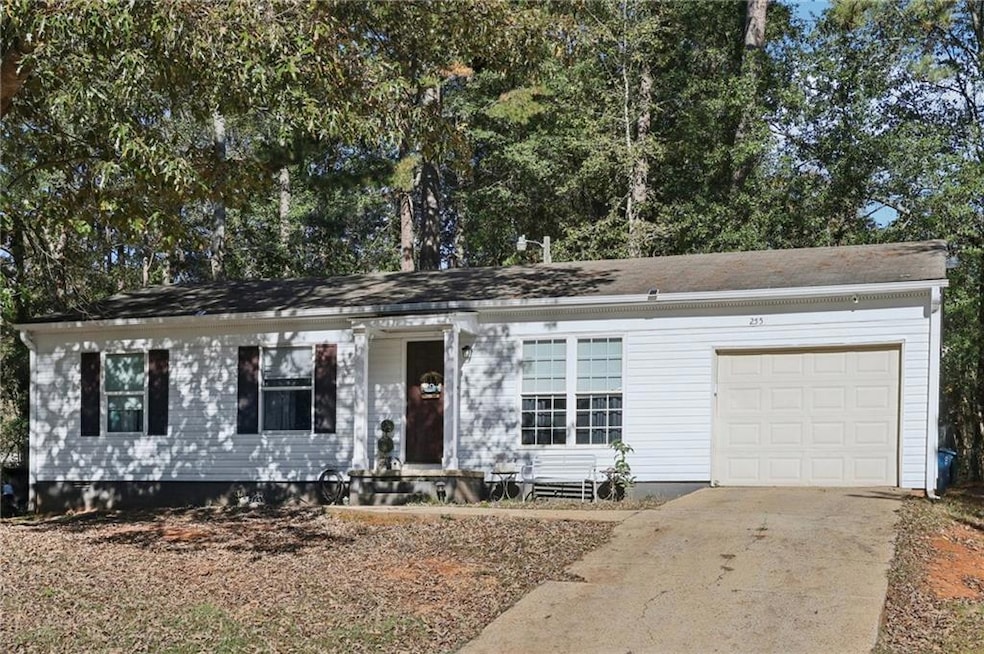
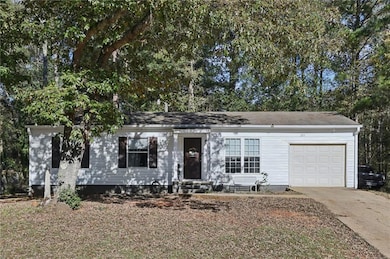
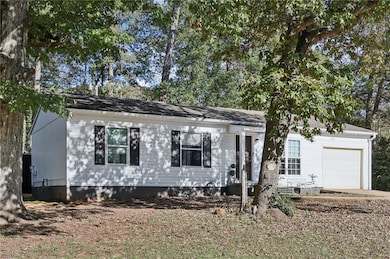
255 Marlborough Downs Rd Bogart, GA 30622
Estimated payment $1,451/month
Highlights
- Accessible Doors
- 1-Story Property
- Central Heating and Cooling System
- Clarke Central High School Rated A-
About This Home
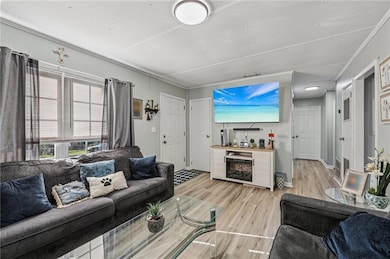
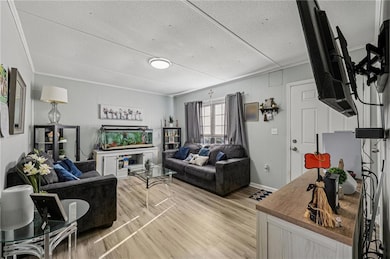
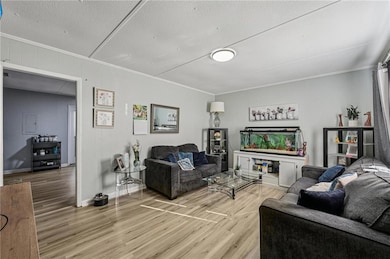
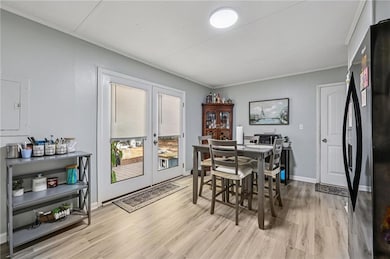
GREAT OPPORTUNITY! Great opportunity to own a maintained 2-bedroom, 1-bath home in Stonehenge community of Bogart, GA. This single-level property is currently tenant-occupied, providing immediate rental income for investors looking for opportunity. Located just minutes from shopping, dining, and major roadways, and a short drive to the University of Georgia and downtown Athens, this property is ideally positioned for continued rental demand.
Property Details
Home Type
- Multi-Family
Est. Annual Taxes
- $1,320
Year Built
- Built in 1971
Home Design
- Shingle Roof
- Shingle Siding
Parking
- 2 Parking Spaces
- Driveway
Schools
- Cleveland Road Elementary School
- Burney-Harris-Lyons Middle School
- Clarke Central High School
Utilities
- Central Heating and Cooling System
- Phone Available
Additional Features
- 1-Story Property
- Accessible Doors
- 0.33 Acre Lot
Community Details
- Stonehenge Subdivision
Listing and Financial Details
- Assessor Parcel Number 044C2 B004
Map
Home Values in the Area
Average Home Value in this Area
Tax History
| Year | Tax Paid | Tax Assessment Tax Assessment Total Assessment is a certain percentage of the fair market value that is determined by local assessors to be the total taxable value of land and additions on the property. | Land | Improvement |
|---|---|---|---|---|
| 2025 | $1,320 | $42,516 | $12,000 | $30,516 |
| 2024 | $1,320 | $38,268 | $12,000 | $26,268 |
| 2023 | $827 | $26,479 | $10,400 | $16,079 |
| 2022 | $756 | $23,686 | $10,400 | $13,286 |
| 2021 | $606 | $17,991 | $5,600 | $12,391 |
| 2020 | $598 | $17,736 | $5,600 | $12,136 |
| 2019 | $534 | $15,729 | $5,600 | $10,129 |
| 2018 | $512 | $15,070 | $4,800 | $10,270 |
| 2017 | $473 | $13,937 | $4,800 | $9,137 |
| 2016 | $442 | $13,021 | $4,800 | $8,221 |
| 2015 | $68 | $12,298 | $4,800 | $7,498 |
| 2014 | $431 | $12,647 | $4,800 | $7,847 |
Property History
| Date | Event | Price | List to Sale | Price per Sq Ft |
|---|---|---|---|---|
| 10/23/2025 10/23/25 | For Sale | $254,000 | -- | -- |
Purchase History
| Date | Type | Sale Price | Title Company |
|---|---|---|---|
| Warranty Deed | -- | -- | |
| Warranty Deed | $90,000 | -- | |
| Warranty Deed | -- | -- | |
| Deed | -- | -- | |
| Deed | $32,450 | -- | |
| Deed | -- | -- | |
| Deed | -- | -- |
Source: First Multiple Listing Service (FMLS)
MLS Number: 7665543
APN: 044C2-B-004
Disclaimer: Certain information contained herein is derived from information provided by parties other than Homes.com. All information provided is deemed reliable, but is not guaranteed to be accurate and should be independently verified.
![]() Listings identified with the FMLS IDX logo come from FMLS and are held by brokerage firms other than the owner of this website. The listing brokerage is identified in any listing details. Information is deemed reliable but is not guaranteed. If you believe any FMLS listing contains material that infringes your copyrighted work please visit www.fmls.com/dmca to review our DMCA policy and learn how to submit a takedown request. © 2025 First Multiple Listing Service, Inc.
Listings identified with the FMLS IDX logo come from FMLS and are held by brokerage firms other than the owner of this website. The listing brokerage is identified in any listing details. Information is deemed reliable but is not guaranteed. If you believe any FMLS listing contains material that infringes your copyrighted work please visit www.fmls.com/dmca to review our DMCA policy and learn how to submit a takedown request. © 2025 First Multiple Listing Service, Inc.
- 805 Zelkova Ridge
- 160 Nunnally St
- 1559 Blackstone Way
- 1372 Blackstone Way
- 632 Creek Pointe Dr
- 1090 Kenway Dr
- 240 Cleveland Rd Unit 105
- 238 Covington Place
- 355 Jennings Mill Pkwy
- 320 Logmont Trace
- 225 Jennings Mill Pkwy
- 125 Jennings Mill Pkwy
- 150 Westpark Dr
- 1520 Binghampton Cir
- 240 W Huntington Rd
- 1021 Binghampton Cir
- 140 Yorkshire Rd
- 219 Deerhill Dr
- 2035 Timothy Rd
- 220 Providence Rd
