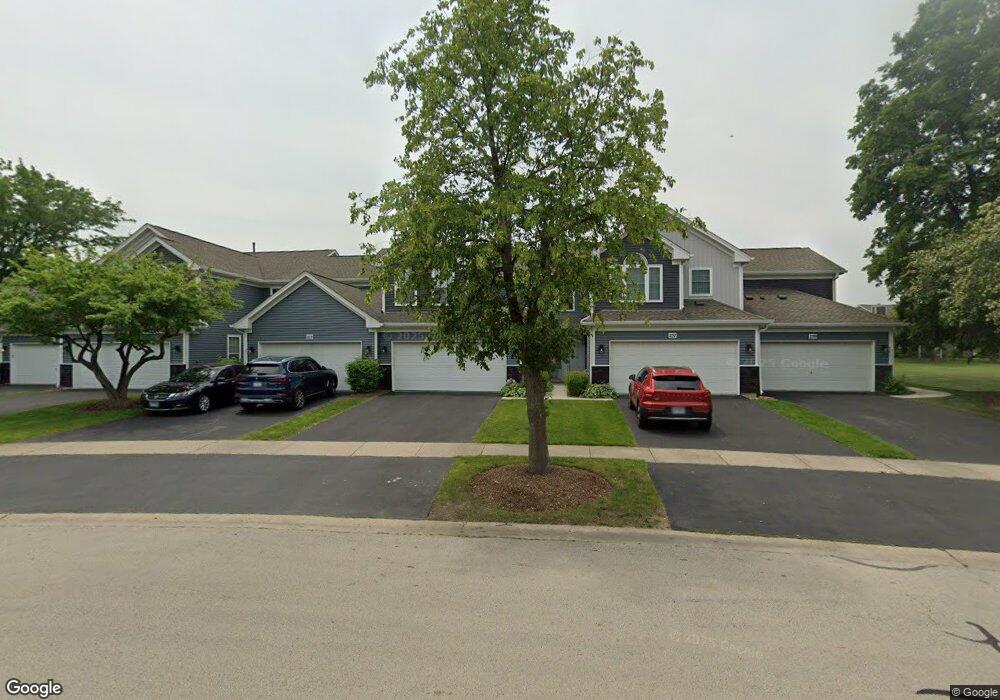
255 Millers Crossing Unit O Itasca, IL 60143
North Itasca NeighborhoodEstimated Value: $352,000 - $372,000
2
Beds
3
Baths
--
Sq Ft
44,431
Sq Ft Lot
About This Home
This home is located at 255 Millers Crossing Unit O, Itasca, IL 60143 and is currently estimated at $359,820. 255 Millers Crossing Unit O is a home located in DuPage County with nearby schools including Raymond Benson Primary School, Elmer H Franzen Intermediate School, and F.E. Peacock Middle School.
Ownership History
Date
Name
Owned For
Owner Type
Purchase Details
Closed on
Jun 9, 2008
Sold by
Cosimo Kim
Bought by
Munoz Ana and Voloder Nermin
Current Estimated Value
Home Financials for this Owner
Home Financials are based on the most recent Mortgage that was taken out on this home.
Original Mortgage
$267,305
Outstanding Balance
$171,441
Interest Rate
6.04%
Mortgage Type
FHA
Estimated Equity
$188,379
Purchase Details
Closed on
Jun 19, 2006
Sold by
Cosimo Frank
Bought by
Cosimo Kim
Purchase Details
Closed on
Jan 31, 2006
Sold by
Rosal Mildred A and Ellis Donald E
Bought by
Cosimo Kim
Purchase Details
Closed on
Dec 17, 1993
Sold by
Wildspring Of Itasca Limited Partnership
Bought by
Rosal Mildred A
Home Financials for this Owner
Home Financials are based on the most recent Mortgage that was taken out on this home.
Original Mortgage
$121,400
Interest Rate
7.25%
Mortgage Type
Purchase Money Mortgage
Create a Home Valuation Report for This Property
The Home Valuation Report is an in-depth analysis detailing your home's value as well as a comparison with similar homes in the area
Home Values in the Area
Average Home Value in this Area
Purchase History
| Date | Buyer | Sale Price | Title Company |
|---|---|---|---|
| Munoz Ana | $271,500 | Atg | |
| Cosimo Kim | -- | None Available | |
| Cosimo Kim | $267,000 | Burnet Title Llc | |
| Rosal Mildred A | $152,000 | -- |
Source: Public Records
Mortgage History
| Date | Status | Borrower | Loan Amount |
|---|---|---|---|
| Open | Munoz Ana | $267,305 | |
| Previous Owner | Rosal Mildred A | $121,400 |
Source: Public Records
Tax History
| Year | Tax Paid | Tax Assessment Tax Assessment Total Assessment is a certain percentage of the fair market value that is determined by local assessors to be the total taxable value of land and additions on the property. | Land | Improvement |
|---|---|---|---|---|
| 2024 | $6,184 | $97,891 | $13,924 | $83,967 |
| 2023 | $5,911 | $89,990 | $12,800 | $77,190 |
| 2022 | $5,491 | $82,920 | $11,800 | $71,120 |
| 2021 | $5,215 | $79,420 | $11,300 | $68,120 |
| 2020 | $5,011 | $76,070 | $10,820 | $65,250 |
| 2019 | $4,887 | $73,140 | $10,400 | $62,740 |
| 2018 | $4,688 | $68,490 | $10,400 | $58,090 |
| 2017 | $4,400 | $65,460 | $9,940 | $55,520 |
| 2016 | $4,243 | $60,440 | $9,180 | $51,260 |
| 2015 | $4,099 | $55,830 | $8,480 | $47,350 |
| 2014 | $4,307 | $55,830 | $8,480 | $47,350 |
| 2013 | $4,212 | $56,970 | $8,650 | $48,320 |
Source: Public Records
Map
Nearby Homes
- 259 Millers Crossing Unit 236
- 201 Millers Crossing Unit 224
- 244 Millers Crossing Unit 244
- 301 Nicole Way
- 829 Clover Ridge Ln
- 417 W Pierce Rd
- 711 E Greenview Rd
- 620 Stone Brook Ct Unit 432
- 100 S Walnut St
- 1239 Old Mill Ln Unit 401
- 741 Old Creek Ct Unit 793
- 312 S Maple St
- 733 Clover Hill Ct
- 922 Little Falls Ct Unit 1016
- 974 Mayfair Ct Unit 83714
- 909 Mayfair Ct Unit 115713
- 99 Essex Rd
- 1149 Carlisle Ave
- 1153 Hawthorne Ln Unit 10026
- 206 E George St
- 255 Millers Crossing Unit 234
- 253 Millers Crossing Unit 233
- 251 Millers Crossing Unit 322
- 193 Millers Crossing Unit 222
- 203 Millers Crossing Unit 225
- 171 Millers Crossing
- 257 Millers Crossing Unit 235
- 197 Millers Crossing Unit 223
- 151 Millers Crossing Unit 211
- 157 Millers Crossing Unit 214
- 225 Millers Crossing Unit 226
- 153 Millers Crossing Unit 212
- 161 Millers Crossing Unit 216
- 161 Millers Crossing Unit 161
- 155 Millers Crossing Unit 213
- 159 Millers Crossing Unit 215
- 248 Millers Crossing Unit 12
- 246 Millers Crossing Unit 13
- 244 Millers Crossing Unit 14
- 141 Millers Crossing Unit 205
Your Personal Tour Guide
Ask me questions while you tour the home.