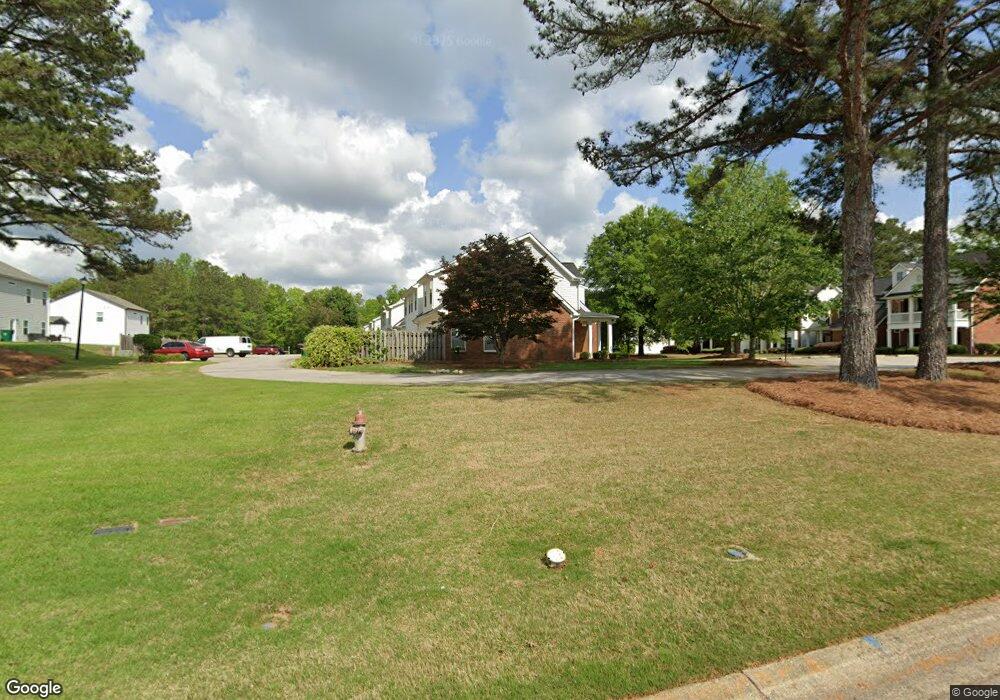
255 Morgan Rd Unit B1 Carrollton, GA 30116
Estimated Value: $228,000 - $251,000
3
Beds
3
Baths
1,574
Sq Ft
$151/Sq Ft
Est. Value
About This Home
This home is located at 255 Morgan Rd Unit B1, Carrollton, GA 30116 and is currently estimated at $238,367, approximately $151 per square foot. 255 Morgan Rd Unit B1 is a home located in Carroll County with nearby schools including Carrollton Elementary School, Carrollton Upper Elementary School, and Carrollton Middle School.
Ownership History
Date
Name
Owned For
Owner Type
Purchase Details
Closed on
Jun 26, 2020
Sold by
Allen Devin Taylor
Bought by
Ethridge Susan S
Current Estimated Value
Home Financials for this Owner
Home Financials are based on the most recent Mortgage that was taken out on this home.
Original Mortgage
$118,750
Interest Rate
3.3%
Mortgage Type
New Conventional
Purchase Details
Closed on
May 5, 2020
Sold by
Tan Sherri
Bought by
Allen Devin Taylor
Home Financials for this Owner
Home Financials are based on the most recent Mortgage that was taken out on this home.
Original Mortgage
$118,750
Interest Rate
3.3%
Mortgage Type
New Conventional
Purchase Details
Closed on
Mar 21, 2003
Sold by
Marlow Christopher Brian
Bought by
Tan Sherri
Purchase Details
Closed on
Mar 22, 2002
Sold by
West Tammy B
Bought by
Marlow Christopher Brian
Purchase Details
Closed on
Jul 20, 2001
Sold by
Malloy Patrick Comm
Bought by
West Tammy B
Purchase Details
Closed on
Apr 25, 2001
Bought by
Malloy Patrick Comm
Create a Home Valuation Report for This Property
The Home Valuation Report is an in-depth analysis detailing your home's value as well as a comparison with similar homes in the area
Home Values in the Area
Average Home Value in this Area
Purchase History
| Date | Buyer | Sale Price | Title Company |
|---|---|---|---|
| Ethridge Susan S | $157,000 | -- | |
| Allen Devin Taylor | $125,000 | -- | |
| Tan Sherri | $126,000 | -- | |
| Marlow Christopher Brian | $118,000 | -- | |
| West Tammy B | $114,500 | -- | |
| Malloy Patrick Comm | -- | -- |
Source: Public Records
Mortgage History
| Date | Status | Borrower | Loan Amount |
|---|---|---|---|
| Previous Owner | Allen Devin Taylor | $118,750 |
Source: Public Records
Tax History Compared to Growth
Tax History
| Year | Tax Paid | Tax Assessment Tax Assessment Total Assessment is a certain percentage of the fair market value that is determined by local assessors to be the total taxable value of land and additions on the property. | Land | Improvement |
|---|---|---|---|---|
| 2024 | $2,238 | $81,917 | $3,654 | $78,263 |
| 2023 | $2,238 | $81,917 | $4,000 | $77,917 |
| 2022 | $1,943 | $66,551 | $4,000 | $62,551 |
| 2021 | $1,682 | $57,621 | $4,000 | $53,621 |
| 2020 | $1,519 | $51,988 | $4,000 | $47,988 |
| 2019 | $1,402 | $47,527 | $4,000 | $43,527 |
| 2018 | $1,410 | $47,115 | $4,000 | $43,115 |
| 2017 | $1,417 | $47,115 | $4,000 | $43,115 |
| 2016 | $1,425 | $47,115 | $4,000 | $43,115 |
| 2015 | $1,271 | $41,153 | $6,000 | $35,154 |
| 2014 | $1,277 | $41,154 | $6,000 | $35,154 |
Source: Public Records
Map
Nearby Homes
- 255 Morgan Rd
- 206 Asher Dr
- 105 Providence Ct
- 221 Turtle Cove
- 0 Knight Dr W
- 115 N Lake Dr
- 2580 Shady Grove Rd
- 231 N Lakeshore Dr
- 0 Old Airport Rd Unit 10599783
- 0 Old Airport Rd Unit 7642336
- 0 Old Airport Rd Unit 10599779
- 223 N Lakeshore Dr
- 1890 Shady Grove Rd
- 1711B Bankhead Hwy
- 45 Sassafrass Way
- 536 N Lakeshore Dr
- 367 Frashier Rd
- 0 Shady Grove Rd Unit 10601173
- 0 Shady Grove Rd Unit 10601172
- 3 Burns Rd
- 255 Morgan Rd
- 255 Morgan Rd
- 255 Morgan Rd Unit A2
- 255 Morgan Rd Unit B2
- 255 Morgan Rd Unit A1
- 255 Morgan Rd Unit A4
- 255 Morgan Rd Unit C1
- 255 Morgan Rd Unit D5
- 255 Morgan Rd Unit A3
- 255 Morgan Rd Unit A5
- 255 Morgan Rd Unit B3
- 255 Morgan Rd Unit B4
- 255 Morgan Rd Unit B5
- 255 Morgan Rd Unit C2
- 255 Morgan Rd Unit C3
- 255 Morgan Rd Unit D1
- 255 Morgan Rd Unit D2
- 255 Morgan Rd Unit D3
- 255 Morgan Rd Unit D4
- 255 Morgan Rd Unit E1