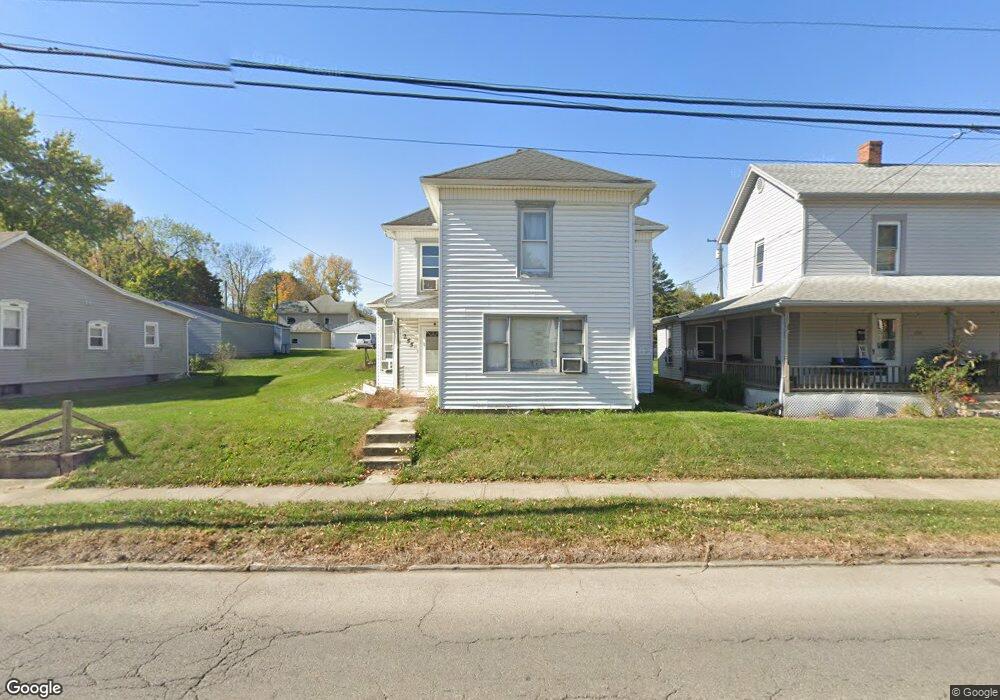
255 N High St Covington, OH 45318
Estimated Value: $149,000 - $158,000
3
Beds
1
Bath
1,608
Sq Ft
$96/Sq Ft
Est. Value
About This Home
This home is located at 255 N High St, Covington, OH 45318 and is currently estimated at $153,851, approximately $95 per square foot. 255 N High St is a home located in Miami County with nearby schools including Covington Elementary/Junior High School, Covington Junior High School, and Covington High School.
Ownership History
Date
Name
Owned For
Owner Type
Purchase Details
Closed on
Oct 10, 2017
Sold by
Shell Kimberly and Shell John
Bought by
J & K Oakview Properties Llc
Current Estimated Value
Purchase Details
Closed on
Apr 27, 2011
Sold by
Fannie Mae
Bought by
Shell John L and Shell Kimberly S
Purchase Details
Closed on
Apr 15, 2011
Sold by
Fannie Mae
Bought by
Shell John L and Shell Kimberly S
Purchase Details
Closed on
Mar 25, 2011
Sold by
Hubbard Anthony W
Bought by
Federal National Mortgage Association
Purchase Details
Closed on
Mar 7, 1994
Bought by
Hubbard Anthony W
Create a Home Valuation Report for This Property
The Home Valuation Report is an in-depth analysis detailing your home's value as well as a comparison with similar homes in the area
Home Values in the Area
Average Home Value in this Area
Purchase History
| Date | Buyer | Sale Price | Title Company |
|---|---|---|---|
| J & K Oakview Properties Llc | -- | -- | |
| Shell John L | $26,200 | -- | |
| Shell John L | $26,200 | -- | |
| Federal National Mortgage Association | $44,000 | -- | |
| Hubbard Anthony W | $69,900 | -- |
Source: Public Records
Tax History
| Year | Tax Paid | Tax Assessment Tax Assessment Total Assessment is a certain percentage of the fair market value that is determined by local assessors to be the total taxable value of land and additions on the property. | Land | Improvement |
|---|---|---|---|---|
| 2025 | $1,449 | $43,370 | $7,950 | $35,420 |
| 2024 | $1,449 | $31,610 | $8,610 | $23,000 |
| 2023 | $1,211 | $31,610 | $8,610 | $23,000 |
| 2022 | $1,208 | $31,610 | $8,610 | $23,000 |
| 2021 | $1,002 | $24,300 | $6,620 | $17,680 |
| 2020 | $1,004 | $24,300 | $6,620 | $17,680 |
| 2019 | $1,009 | $24,300 | $6,620 | $17,680 |
| 2018 | $396 | $9,520 | $5,670 | $3,850 |
| 2017 | $403 | $9,520 | $5,670 | $3,850 |
| 2016 | $398 | $9,520 | $5,670 | $3,850 |
| 2015 | $368 | $9,170 | $5,460 | $3,710 |
| 2014 | $368 | $9,170 | $5,460 | $3,710 |
| 2013 | $355 | $9,170 | $5,460 | $3,710 |
Source: Public Records
Map
Nearby Homes
Your Personal Tour Guide
Ask me questions while you tour the home.