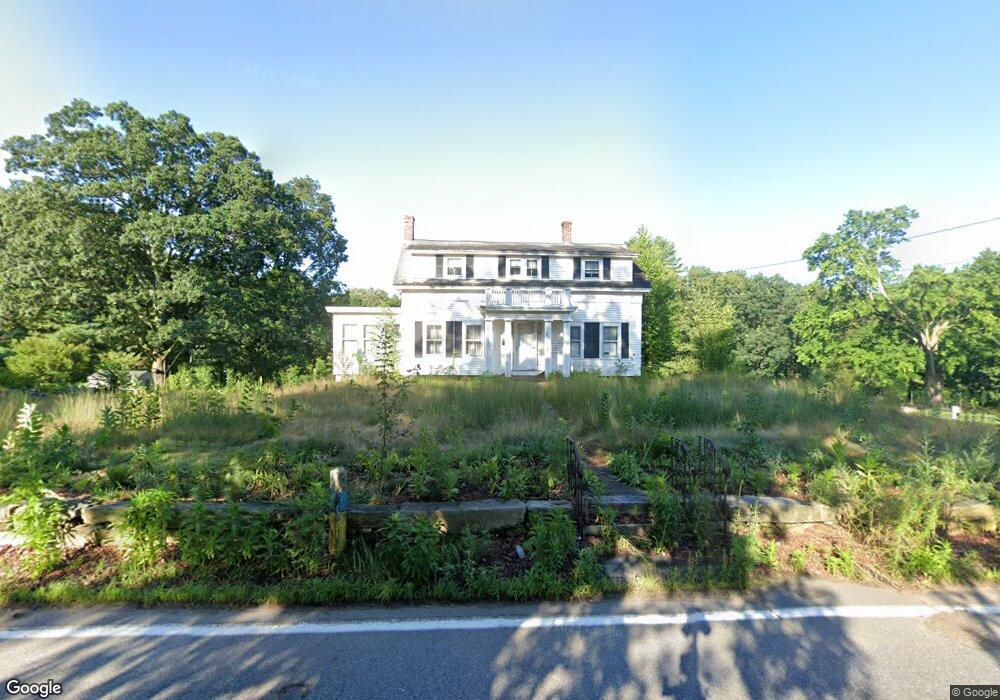
255 N Main St Whitinsville, MA 01588
Estimated Value: $330,000 - $507,000
4
Beds
2
Baths
1,841
Sq Ft
$239/Sq Ft
Est. Value
About This Home
This home is located at 255 N Main St, Whitinsville, MA 01588 and is currently estimated at $440,817, approximately $239 per square foot. 255 N Main St is a home located in Worcester County with nearby schools including Northbridge Elementary School, Northbridge Middle School, and Northbridge High School.
Ownership History
Date
Name
Owned For
Owner Type
Purchase Details
Closed on
Nov 10, 2016
Sold by
Tomanini Lori and Jordan Christine
Bought by
Chilton Kendell A
Current Estimated Value
Home Financials for this Owner
Home Financials are based on the most recent Mortgage that was taken out on this home.
Original Mortgage
$108,750
Outstanding Balance
$51,518
Interest Rate
3.42%
Mortgage Type
New Conventional
Estimated Equity
$389,299
Purchase Details
Closed on
Jul 15, 2009
Sold by
Schweinfurth Rosalie and Almasian Mary
Bought by
Jordan Christine and Tomanini Lori
Create a Home Valuation Report for This Property
The Home Valuation Report is an in-depth analysis detailing your home's value as well as a comparison with similar homes in the area
Home Values in the Area
Average Home Value in this Area
Purchase History
| Date | Buyer | Sale Price | Title Company |
|---|---|---|---|
| Chilton Kendell A | $145,000 | -- | |
| Chilton Kendell A | $145,000 | -- | |
| Chilton Kendell A | $145,000 | -- | |
| Jordan Christine | -- | -- | |
| Jordan Christine | -- | -- |
Source: Public Records
Mortgage History
| Date | Status | Borrower | Loan Amount |
|---|---|---|---|
| Open | Chilton Kendell A | $108,750 | |
| Closed | Chilton Kendell A | $108,750 |
Source: Public Records
Tax History Compared to Growth
Tax History
| Year | Tax Paid | Tax Assessment Tax Assessment Total Assessment is a certain percentage of the fair market value that is determined by local assessors to be the total taxable value of land and additions on the property. | Land | Improvement |
|---|---|---|---|---|
| 2025 | $1,993 | $169,000 | $141,900 | $27,100 |
| 2024 | $2,013 | $166,500 | $141,900 | $24,600 |
| 2023 | $2,045 | $157,800 | $134,400 | $23,400 |
| 2022 | $3,420 | $248,400 | $103,400 | $145,000 |
| 2021 | $2,094 | $144,500 | $98,500 | $46,000 |
| 2020 | $1,974 | $142,600 | $98,500 | $44,100 |
| 2019 | $1,817 | $140,100 | $98,500 | $41,600 |
| 2018 | $3,120 | $234,300 | $93,700 | $140,600 |
| 2017 | $3,024 | $223,500 | $93,700 | $129,800 |
| 2016 | $2,588 | $188,200 | $80,400 | $107,800 |
| 2015 | $2,518 | $188,200 | $80,400 | $107,800 |
| 2014 | $2,496 | $188,200 | $80,400 | $107,800 |
Source: Public Records
Map
Nearby Homes