
Seller's Agent in 2018
Judy Kilgour
Long & Foster
(804) 363-1753
160 Total Sales
Estimated Value: $310,221 - $324,000
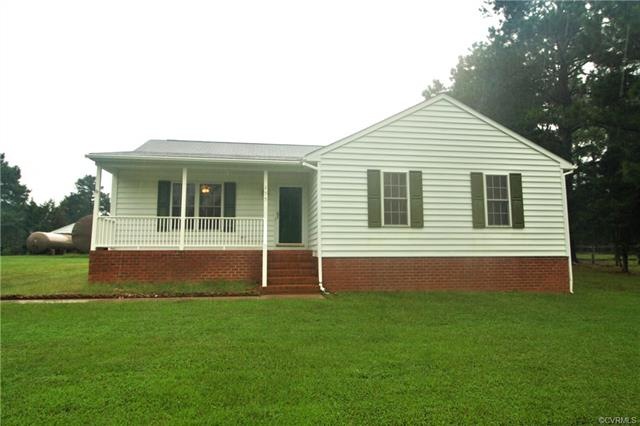
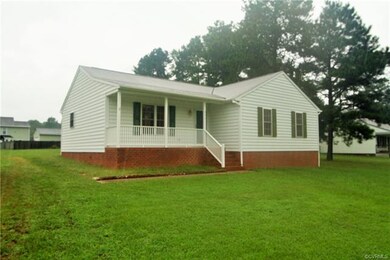
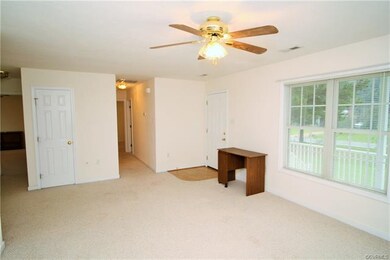
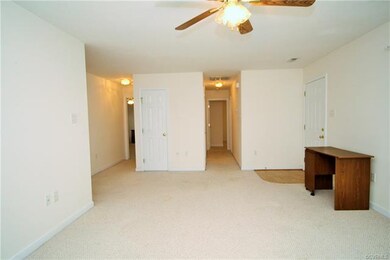
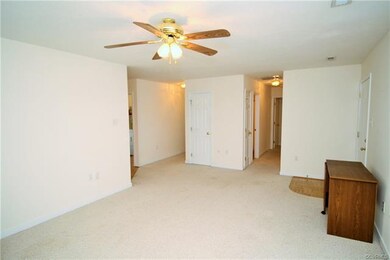
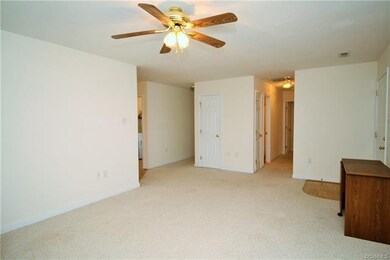
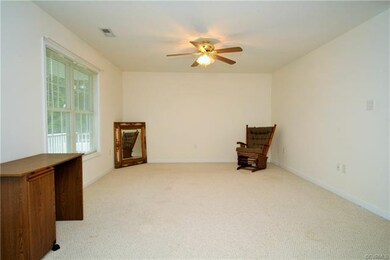
Welcome home to this beautiful move-in ready 3 bedroom, 2 bath Rancher! Located close to Rt. 360 off of Rt. 30 in Venter Heights subdivision. This custom built home is being offered for the first time since it was built new in 2001! Eat-in kitchen, large dining room, large master bedroom are just some of the things this home has to offer! HMS warranty provided by the seller!
Last Agent to Sell the Property
Long & Foster REALTORS License #0225167623 Listed on: 09/17/2018
We collect this data history from publicly available records. To have your information removed, we recommend requesting removal directly through your county’s website.
We collect this data history from publicly available records. To have your information removed, we recommend requesting removal directly through your county’s website.
| Date | Buyer | Sale Price | Title Company |
|---|---|---|---|
| $179,000 | Dominion Capital Title |
We collect this data history from publicly available records. To have your information removed, we recommend requesting removal directly through your county’s website.
| Date | Status | Borrower | Loan Amount |
|---|---|---|---|
| Open | $180,808 |
We collect this data history from publicly available records. To have your information removed, we recommend requesting removal directly through your county’s website.
| Date | Event | Price | List to Sale | Price per Sq Ft |
|---|---|---|---|---|
| 11/16/2018 11/16/18 | Sold | $179,000 | -0.5% | $134 / Sq Ft |
| 10/09/2018 10/09/18 | Pending | -- | -- | -- |
| 09/17/2018 09/17/18 | For Sale | $179,950 | -- | $135 / Sq Ft |
We collect this data history from publicly available records. To have your information removed, we recommend requesting removal directly through your county’s website.
| Year | Tax Paid | Tax Assessment Tax Assessment Total Assessment is a certain percentage of the fair market value that is determined by local assessors to be the total taxable value of land and additions on the property. | Land | Improvement |
|---|---|---|---|---|
| 2025 | $1,247 | $202,800 | $40,000 | $162,800 |
| 2024 | $1,176 | $202,800 | $40,000 | $162,800 |
| 2023 | $1,176 | $202,800 | $40,000 | $162,800 |
| 2022 | $1,101 | $131,900 | $30,000 | $101,900 |
| 2021 | $1,134 | $131,900 | $30,000 | $101,900 |
| 2020 | $1,134 | $185,300 | $35,000 | $150,300 |
| 2019 | $1,134 | $131,100 | $30,000 | $101,100 |
| 2018 | $0 | $131,900 | $30,000 | $101,900 |
| 2017 | $94 | $131,900 | $30,000 | $101,900 |
| 2016 | $310 | $131,900 | $30,000 | $101,900 |
| 2015 | $310 | $131,900 | $30,000 | $101,900 |
| 2014 | $441 | $0 | $0 | $0 |
Seller's Agent in 2018
Judy Kilgour
Long & Foster
(804) 363-1753
160 Total Sales
K
Seller Co-Listing Agent in 2018
Kevin Kilgour
Long & Foster
(804) 347-8615
50 Total Sales
Buyer's Agent in 2018
Chris Iguchi
Craft Living Real Estate
(804) 301-6553
49 Total Sales
Source: Central Virginia Regional MLS
MLS Number: 1833303
APN: 21D-2B-6
Disclaimer: Certain information contained herein is derived from information provided by parties other than Homes.com. All information provided is deemed reliable, but is not guaranteed to be accurate and should be independently verified.
![]() All or a portion of th multiple Listing information is provided by the Central Virginia Regional Multiple Listing Service, LLC, from a copyrighted compilation of Listing s. All CVR MLS information provided is deemed reliable but is not guaranteed accurate. The compilation of Listings and each individual Listing are ©2026 Central Virginia Regional Multiple Listing Service, LLC. All rights reserved.
All or a portion of th multiple Listing information is provided by the Central Virginia Regional Multiple Listing Service, LLC, from a copyrighted compilation of Listing s. All CVR MLS information provided is deemed reliable but is not guaranteed accurate. The compilation of Listings and each individual Listing are ©2026 Central Virginia Regional Multiple Listing Service, LLC. All rights reserved.
Ask me questions while you tour the home.