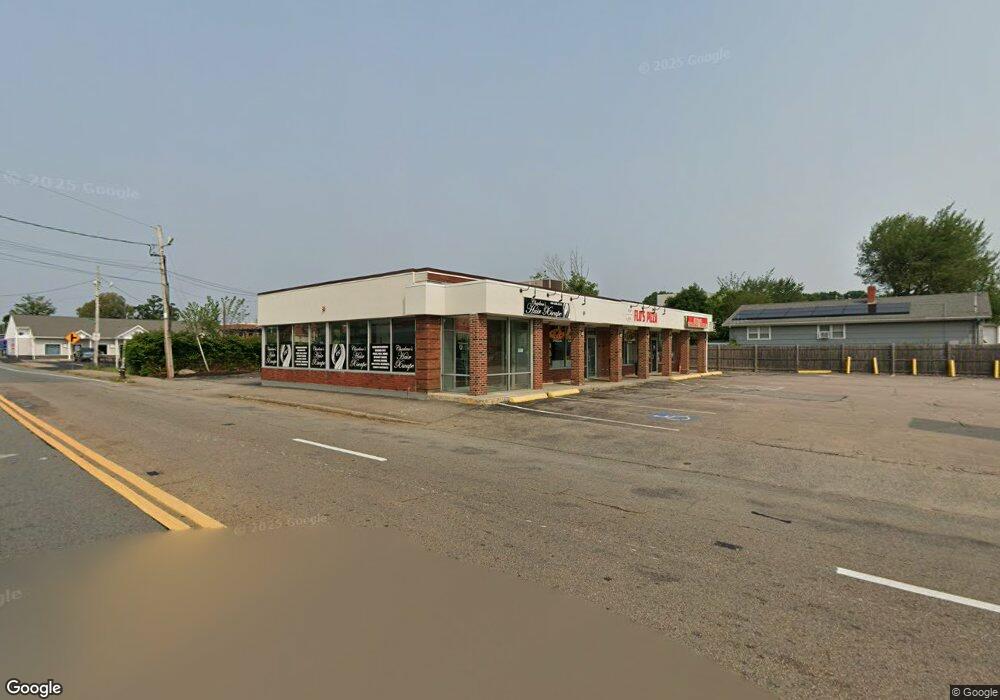
255 Quincy St Unit End Cap Brockton, MA 02302
2
Beds
1
Bath
780
Sq Ft
0.33
Acres
About This Home
This home is located at 255 Quincy St Unit End Cap, Brockton, MA 02302. 255 Quincy St Unit End Cap is a home located in Plymouth County with nearby schools including Brookfield Elementary School, Mary E. Baker Elementary School, and Downey Elementary School.
Ownership History
Date
Name
Owned For
Owner Type
Purchase Details
Closed on
Feb 15, 2019
Sold by
Rajjah Llc
Bought by
Rajjah Rt
Home Financials for this Owner
Home Financials are based on the most recent Mortgage that was taken out on this home.
Original Mortgage
$658,373
Outstanding Balance
$577,647
Interest Rate
4.4%
Mortgage Type
New Conventional
Purchase Details
Closed on
Mar 30, 2018
Sold by
Thai Irene and Thai Dauly
Bought by
Rajjah Llc
Purchase Details
Closed on
Jul 3, 2006
Sold by
750 Centre Street Rt
Bought by
Thai Irene and Thai Dauly
Purchase Details
Closed on
Mar 10, 2004
Sold by
South Shore Rt
Bought by
750 Centre St Rt Of Br
Home Financials for this Owner
Home Financials are based on the most recent Mortgage that was taken out on this home.
Original Mortgage
$335,000
Interest Rate
5.67%
Mortgage Type
Commercial
Create a Home Valuation Report for This Property
The Home Valuation Report is an in-depth analysis detailing your home's value as well as a comparison with similar homes in the area
Home Values in the Area
Average Home Value in this Area
Purchase History
| Date | Buyer | Sale Price | Title Company |
|---|---|---|---|
| Rajjah Rt | $658,373 | -- | |
| Rajjah Llc | $650,000 | -- | |
| Thai Irene | -- | -- | |
| Thai Irene | $698,000 | -- | |
| 750 Centre St Rt Of Br | $400,000 | -- |
Source: Public Records
Mortgage History
| Date | Status | Borrower | Loan Amount |
|---|---|---|---|
| Open | Rajjah Rt | $658,373 | |
| Previous Owner | 750 Centre St Rt Of Br | $335,000 |
Source: Public Records
Tax History Compared to Growth
Tax History
| Year | Tax Paid | Tax Assessment Tax Assessment Total Assessment is a certain percentage of the fair market value that is determined by local assessors to be the total taxable value of land and additions on the property. | Land | Improvement |
|---|---|---|---|---|
| 2025 | $13,697 | $566,000 | $198,100 | $367,900 |
| 2024 | $12,953 | $538,600 | $198,100 | $340,500 |
| 2023 | $12,739 | $489,600 | $171,900 | $317,700 |
| 2022 | $12,501 | $443,600 | $171,900 | $271,700 |
| 2021 | $12,544 | $423,200 | $163,800 | $259,400 |
| 2020 | $12,870 | $423,200 | $155,900 | $267,300 |
| 2019 | $12,814 | $404,600 | $155,900 | $248,700 |
| 2018 | $12,768 | $396,000 | $155,900 | $240,100 |
| 2017 | $12,768 | $387,600 | $155,900 | $231,700 |
| 2016 | $11,751 | $367,000 | $155,930 | $211,070 |
| 2015 | $12,434 | $367,000 | $155,930 | $211,070 |
| 2014 | $12,463 | $367,000 | $155,930 | $211,070 |
Source: Public Records
Map
Nearby Homes