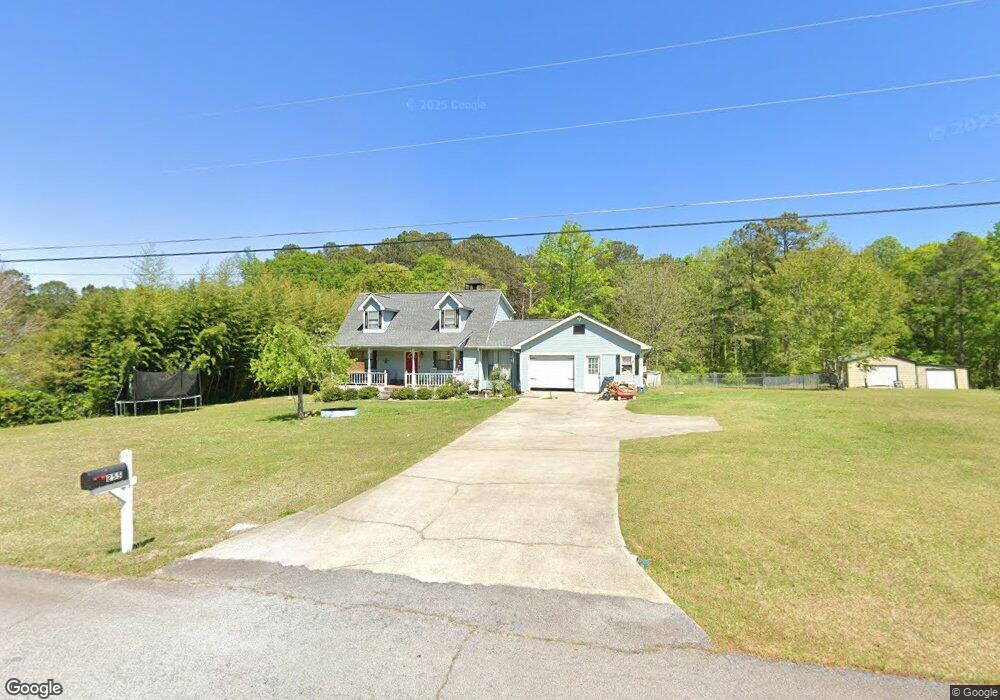
255 Russell Ln Carrollton, GA 30116
Abilene NeighborhoodEstimated Value: $227,000 - $294,000
3
Beds
2
Baths
1,850
Sq Ft
$144/Sq Ft
Est. Value
About This Home
This home is located at 255 Russell Ln, Carrollton, GA 30116 and is currently estimated at $265,529, approximately $143 per square foot. 255 Russell Ln is a home located in Carroll County with nearby schools including Sand Hill Elementary School, Bay Springs Middle School, and Villa Rica High School.
Ownership History
Date
Name
Owned For
Owner Type
Purchase Details
Closed on
Sep 26, 2015
Sold by
Junek Joseph William
Bought by
Junek Lisa Bryant
Current Estimated Value
Purchase Details
Closed on
May 30, 2012
Sold by
Lobo Audrey L
Bought by
Junek Joseph W and Junek Lisa B
Purchase Details
Closed on
Jan 18, 2006
Sold by
Walters Charles A
Bought by
Lobo Audrey
Home Financials for this Owner
Home Financials are based on the most recent Mortgage that was taken out on this home.
Original Mortgage
$111,000
Interest Rate
6.21%
Mortgage Type
New Conventional
Purchase Details
Closed on
May 3, 2005
Sold by
Walters Charles A
Bought by
Walters Charles A and Walters Candace L
Purchase Details
Closed on
Apr 28, 2003
Sold by
Hamadany Richard A and Hamadany Susan
Bought by
Walters Charles A and Walters Candace L
Purchase Details
Closed on
Aug 8, 2002
Sold by
Hamadany Sam
Bought by
Hamadany Richard A and Hamadany Susan
Purchase Details
Closed on
Jan 9, 1990
Bought by
Hamadany
Create a Home Valuation Report for This Property
The Home Valuation Report is an in-depth analysis detailing your home's value as well as a comparison with similar homes in the area
Home Values in the Area
Average Home Value in this Area
Purchase History
| Date | Buyer | Sale Price | Title Company |
|---|---|---|---|
| Junek Lisa Bryant | $40,000 | -- | |
| Junek Joseph W | $40,000 | -- | |
| Lobo Audrey | -- | -- | |
| Walters Charles A | -- | -- | |
| Walters Charles A | $98,000 | -- | |
| Hamadany Richard A | -- | -- | |
| Hamadany | $10,500 | -- |
Source: Public Records
Mortgage History
| Date | Status | Borrower | Loan Amount |
|---|---|---|---|
| Previous Owner | Lobo Audrey | $111,000 |
Source: Public Records
Tax History Compared to Growth
Tax History
| Year | Tax Paid | Tax Assessment Tax Assessment Total Assessment is a certain percentage of the fair market value that is determined by local assessors to be the total taxable value of land and additions on the property. | Land | Improvement |
|---|---|---|---|---|
| 2024 | $1,659 | $92,583 | $9,840 | $82,743 |
| 2023 | $1,659 | $85,160 | $9,840 | $75,320 |
| 2022 | $1,419 | $70,199 | $9,840 | $60,359 |
| 2021 | $1,300 | $61,676 | $9,840 | $51,836 |
| 2020 | $1,204 | $56,262 | $9,840 | $46,422 |
| 2019 | $1,144 | $52,506 | $9,840 | $42,666 |
| 2018 | $978 | $42,606 | $6,560 | $36,046 |
| 2017 | $981 | $42,606 | $6,560 | $36,046 |
| 2016 | $982 | $42,606 | $6,560 | $36,046 |
| 2015 | $960 | $38,331 | $7,200 | $31,132 |
| 2014 | $964 | $38,332 | $7,200 | $31,132 |
Source: Public Records
Map
Nearby Homes
- 0 Roy Morgan Rd Unit 17.44 ACRES
- 160 & 168 Roy Morgan Rd
- 0 Roy Morgan Rd Unit 7671946
- 202 Old Sandhill Rd
- 160 Old Sandhill Rd
- 56 Dahlia Ct
- 352 Price Rd
- 0
- 382 Price Rd
- 136 Jennifer Ln
- 472 Price Rd
- 0 Paynes Lake Rd Unit 7339831
- 0 Paynes Lake Rd Unit 10254856
- 415 Paynes Lake Rd
- 27 Mimosa Cir
- 436 Laurel Trace
- 3279 Shady Grove Rd
- 55 Sage Hill Dr
- 3487 Carrollton Villa Rica Hwy
- 125 Muscadine Way
- 239 Russell Ln
- 239 Russell Ln Unit 15
- 254 Russell Ln
- 268 Russell Ln
- 225 Russell Ln
- 281 Russell Ln
- 222 Russell Ln
- 282 Russell Ln
- 295 Russell Ln
- 201 Russell Ln
- 210 Russell Ln
- 296 Russell Ln
- 307 Russell Ln Unit 10
- 196 Russell Ln
- 310 Russell Ln
- 350 Roy Morgan Rd
- 350 Roy Morgan Rd Unit 3
- 175 Russell Ln
- 168 Russell Ln
- 300 Roy Morgan Rd