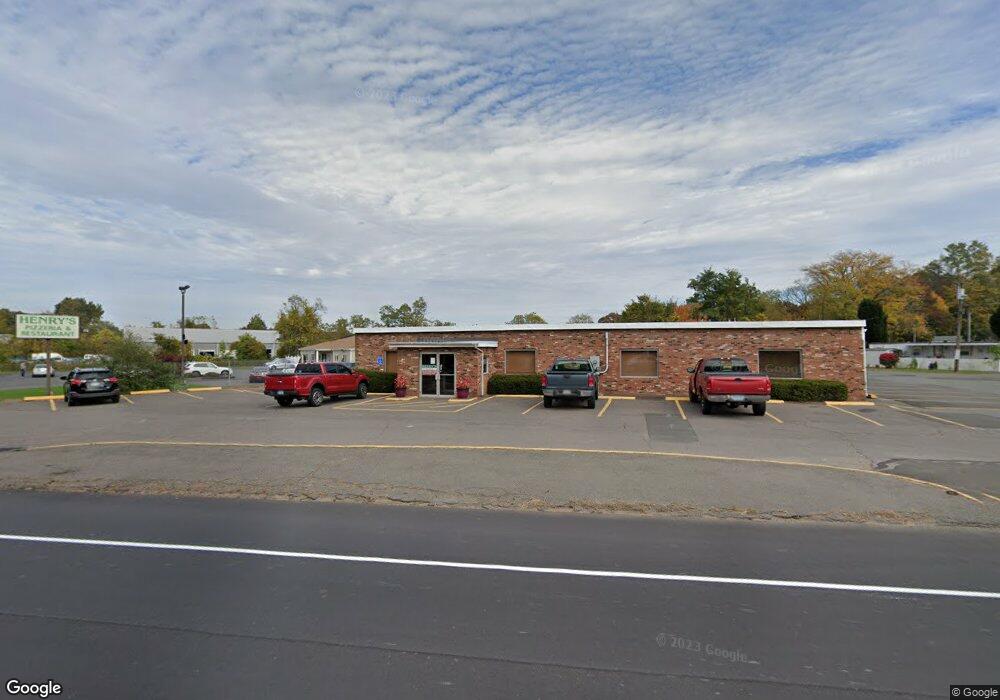
255 S Main St East Windsor, CT 06088
Estimated Value: $784,000
--
Bed
2
Baths
2,602
Sq Ft
$301/Sq Ft
Est. Value
About This Home
This home is located at 255 S Main St, East Windsor, CT 06088 and is currently priced at $784,000, approximately $301 per square foot. 255 S Main St is a home located in Hartford County with nearby schools including Broad Brook Elementary School, East Windsor Middle School, and East Windsor High School.
Ownership History
Date
Name
Owned For
Owner Type
Purchase Details
Closed on
Feb 5, 2024
Sold by
Hess Gabriel
Bought by
Mccluster Tineus
Current Estimated Value
Purchase Details
Closed on
May 16, 2023
Sold by
Symonds John W
Bought by
Ouellette Alan J
Purchase Details
Closed on
Oct 28, 2022
Sold by
Armstrong Jacquelyn Y Est and Nasuta
Bought by
Larose John J
Purchase Details
Closed on
Sep 19, 2019
Sold by
Sheldon Edwin R Jr Est and Hunter
Bought by
Dimauro Anglo J
Purchase Details
Closed on
May 1, 2015
Sold by
Burnette Laurence
Bought by
Burnette Mark
Create a Home Valuation Report for This Property
The Home Valuation Report is an in-depth analysis detailing your home's value as well as a comparison with similar homes in the area
Home Values in the Area
Average Home Value in this Area
Purchase History
| Date | Buyer | Sale Price | Title Company |
|---|---|---|---|
| Mccluster Tineus | -- | None Available | |
| Mccluster Tineus | -- | None Available | |
| Ouellette Alan J | $20,000 | None Available | |
| Ouellette Alan J | $20,000 | None Available | |
| Larose John J | $29,000 | None Available | |
| Larose John J | $29,000 | None Available | |
| Dimauro Anglo J | $4,500 | -- | |
| Dimauro Anglo J | $4,500 | -- | |
| Burnette Mark | -- | -- | |
| Burnette Mark | -- | -- |
Source: Public Records
Mortgage History
| Date | Status | Borrower | Loan Amount |
|---|---|---|---|
| Previous Owner | Burnette Mark | $180,000 | |
| Previous Owner | Burnette Mark | $45,000 | |
| Previous Owner | Burnette Mark | $225,000 |
Source: Public Records
Tax History Compared to Growth
Tax History
| Year | Tax Paid | Tax Assessment Tax Assessment Total Assessment is a certain percentage of the fair market value that is determined by local assessors to be the total taxable value of land and additions on the property. | Land | Improvement |
|---|---|---|---|---|
| 2025 | $14,891 | $550,900 | $230,300 | $320,600 |
| 2024 | $14,412 | $550,900 | $230,300 | $320,600 |
| 2023 | $20,866 | $570,410 | $299,250 | $271,160 |
| 2022 | $20,723 | $570,410 | $299,250 | $271,160 |
| 2021 | $20,763 | $570,410 | $299,250 | $271,160 |
| 2020 | $20,774 | $570,410 | $299,250 | $271,160 |
| 2019 | $20,335 | $570,410 | $299,250 | $271,160 |
| 2018 | $20,135 | $570,410 | $299,250 | $271,160 |
| 2017 | $18,683 | $548,370 | $299,250 | $249,120 |
| 2016 | $17,619 | $548,370 | $299,250 | $249,120 |
| 2015 | $16,621 | $548,370 | $299,250 | $249,120 |
| 2014 | -- | $548,370 | $299,250 | $249,120 |
Source: Public Records
Map
Nearby Homes
- 372 Scantic Rd Unit 8
- 34 W River Rd
- 27 W River Rd
- 18 Cathy (Lot 17) Ln
- 20 Cathy (Lot 16) Ln
- 17 Cathy (Lot 18) Ln
- 19 Cathy (Lot 19) Ln
- 22 Cathy (Lot 15) Ln
- 24 Cathy (Lot 14) Ln
- 21 Ln
- 26 Cathy (Lot 13) Ln
- 23 Cathy (Lot 21) Ln
- 29 W River Rd
- 43 W River Rd
- 1333 Palisado Ave
- 24 MacKtown Rd
- 47 Ferry Ln
- 625 Palisado Ave Unit 310
- 957 Palisado Ave
- 20 Phelps Rd
- 255 S Main St Unit MH
- 255 S Main St Unit LEASE RESTAURANT
- 255 S Main St Unit MOBILE HOME PARK & L
- 255 S Main St Unit RESTAURANT ONLY
- 255 S Main St Unit 5
- 256 S Main St
- 254 S Main St
- 257 S Main St Unit 17
- 257 S Main St
- 252 S Main St
- 252 S Main St Unit E
- 245 S Main St
- 248 S Main St
- 266 S Main St
- 268 S Main St
- 239 S Main St
- 229 S Main St
- 237 S Main St
- 235 S Main St
- 233 S Main St