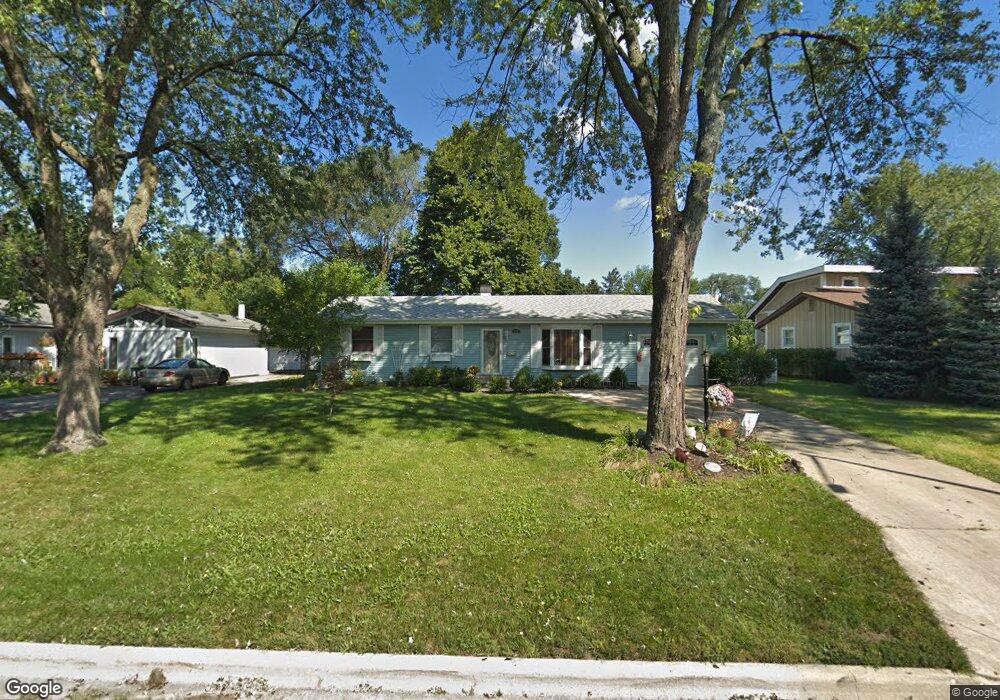
255 Tomahawk Ct Unit 2 Carol Stream, IL 60188
Estimated Value: $357,000 - $365,585
3
Beds
2
Baths
1,443
Sq Ft
$251/Sq Ft
Est. Value
About This Home
This home is located at 255 Tomahawk Ct Unit 2, Carol Stream, IL 60188 and is currently estimated at $362,396, approximately $251 per square foot. 255 Tomahawk Ct Unit 2 is a home located in DuPage County with nearby schools including Carol Stream Elementary School, Jay Stream Middle School, and Glenbard North High School.
Ownership History
Date
Name
Owned For
Owner Type
Purchase Details
Closed on
Sep 23, 2011
Sold by
Rieder Kristina and Rieder Etienne
Bought by
Lehmkuhle Ronald D
Current Estimated Value
Home Financials for this Owner
Home Financials are based on the most recent Mortgage that was taken out on this home.
Original Mortgage
$163,253
Outstanding Balance
$111,741
Interest Rate
4.25%
Mortgage Type
FHA
Estimated Equity
$250,655
Purchase Details
Closed on
Dec 22, 2004
Sold by
Wilger Richard R and Wilger Dayle A
Bought by
Blomsness Kristina
Home Financials for this Owner
Home Financials are based on the most recent Mortgage that was taken out on this home.
Original Mortgage
$175,000
Interest Rate
5.37%
Mortgage Type
Purchase Money Mortgage
Create a Home Valuation Report for This Property
The Home Valuation Report is an in-depth analysis detailing your home's value as well as a comparison with similar homes in the area
Home Values in the Area
Average Home Value in this Area
Purchase History
| Date | Buyer | Sale Price | Title Company |
|---|---|---|---|
| Lehmkuhle Ronald D | $167,500 | Fort Dearborn Land Title Llc | |
| Blomsness Kristina | $220,000 | Guarantee Tile & Trust Co |
Source: Public Records
Mortgage History
| Date | Status | Borrower | Loan Amount |
|---|---|---|---|
| Open | Lehmkuhle Ronald D | $163,253 | |
| Previous Owner | Blomsness Kristina | $175,000 |
Source: Public Records
Tax History
| Year | Tax Paid | Tax Assessment Tax Assessment Total Assessment is a certain percentage of the fair market value that is determined by local assessors to be the total taxable value of land and additions on the property. | Land | Improvement |
|---|---|---|---|---|
| 2024 | $8,071 | $102,079 | $31,023 | $71,056 |
| 2023 | $7,626 | $93,350 | $28,370 | $64,980 |
| 2022 | $7,396 | $86,170 | $28,190 | $57,980 |
| 2021 | $7,048 | $81,870 | $26,780 | $55,090 |
| 2020 | $6,930 | $79,880 | $26,130 | $53,750 |
| 2019 | $6,663 | $76,760 | $25,110 | $51,650 |
| 2018 | $6,122 | $71,900 | $24,450 | $47,450 |
| 2017 | $5,779 | $66,640 | $22,660 | $43,980 |
| 2016 | $5,462 | $61,670 | $20,970 | $40,700 |
| 2015 | $5,328 | $57,550 | $19,570 | $37,980 |
| 2014 | $5,381 | $57,120 | $20,230 | $36,890 |
| 2013 | $5,415 | $59,070 | $20,920 | $38,150 |
Source: Public Records
Map
Nearby Homes
- 1N053 Lot 1 Farwell St
- 1N063 LOT 2 Farwell St
- 1N083 LOT 4 Farwell St
- 1043 Quarry Ct Unit 11
- 1421 Preserve Dr Unit 18
- 1N073 LOT 3 Farwell St
- 1N082 LOT 6 Morse St
- 1027 Quarry Ct Unit 7
- 192 Surrey Dr
- 155 Surrey Dr
- 403 Arrowhead Trail
- 565 Edgebrook Ct
- 27W130 W Street Charles Rd
- 648 Thunderbird Trail
- 720 Hoover Dr Unit 124
- 768 N Gary Ave Unit 103
- 1426 Preserve Dr Unit 30
- 1035 Quarry Ct Unit 9
- 517 Danbury Dr
- 788 N Gary Ave Unit 103
- 259 Tomahawk Ct
- 245 Tomahawk Ct
- 256 Mohawk Dr
- 260 Mohawk Dr
- 269 Tomahawk Ct
- 246 Mohawk Dr
- 266 Mohawk Dr
- 235 Tomahawk Ct
- 254 Tomahawk Ct
- 258 Tomahawk Ct
- 240 Mohawk Dr
- 244 Tomahawk Ct
- 275 Tomahawk Ct
- 270 Mohawk Dr
- 268 Tomahawk Ct
- 234 Tomahawk Ct Unit 2
- 216 Yuma Ln
- 285 Tomahawk Ct
- 280 Mohawk Dr
- 225 Tomahawk Ct
Your Personal Tour Guide
Ask me questions while you tour the home.