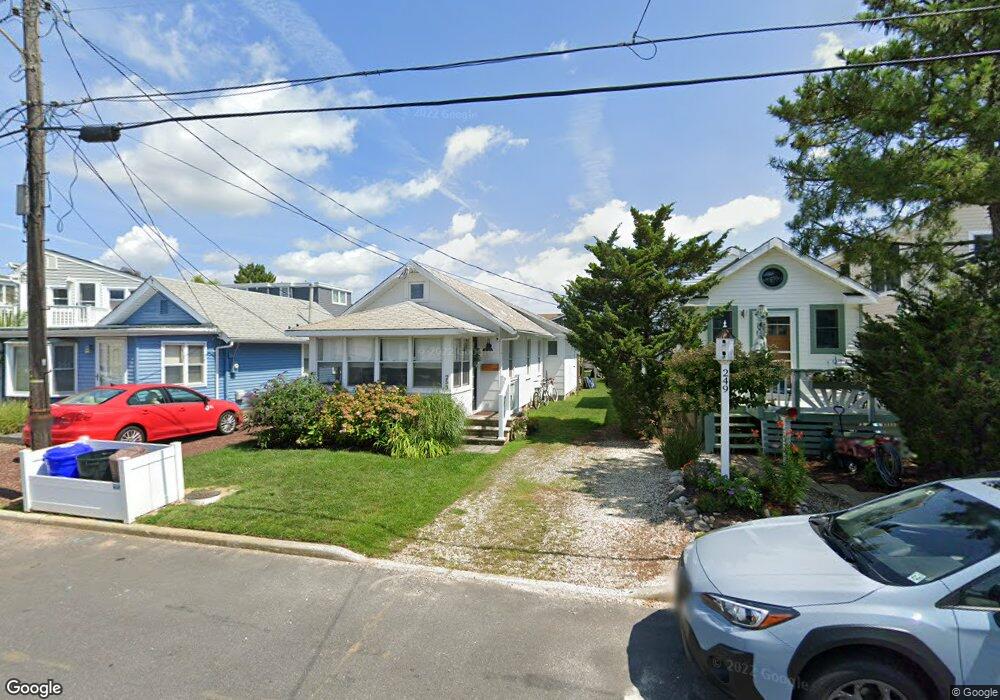
255 W 21st St Ship Bottom, NJ 08008
Long Beach Island NeighborhoodEstimated Value: $781,007 - $1,079,000
2
Beds
1
Bath
868
Sq Ft
$1,127/Sq Ft
Est. Value
About This Home
This home is located at 255 W 21st St, Ship Bottom, NJ 08008 and is currently estimated at $978,002, approximately $1,126 per square foot. 255 W 21st St is a home located in Ocean County with nearby schools including Ethel A. Jacobsen Elementary School, Long Beach Island Grade School, and Southern Regional Middle School.
Ownership History
Date
Name
Owned For
Owner Type
Purchase Details
Closed on
Feb 21, 2023
Sold by
Tirado Daphne C and Tirado Leo A
Bought by
Tirado Crockett Living Trust
Current Estimated Value
Purchase Details
Closed on
Oct 14, 2016
Sold by
Neufeld Hans-Peter
Bought by
Dundore Corin and Dundore Kevin
Purchase Details
Closed on
Oct 27, 2005
Sold by
Tirado Daphne C
Bought by
Tirado Daphne C and Tirado Leo A
Purchase Details
Closed on
Jul 17, 1999
Sold by
Crockett Marilu Gibbons and Tirado Daphne Crockett
Bought by
Crockett Marilu Gibbons and Tirado Daphne Crockett
Create a Home Valuation Report for This Property
The Home Valuation Report is an in-depth analysis detailing your home's value as well as a comparison with similar homes in the area
Home Values in the Area
Average Home Value in this Area
Purchase History
| Date | Buyer | Sale Price | Title Company |
|---|---|---|---|
| Tirado Crockett Living Trust | -- | -- | |
| Tirado Crockett Living Trust | -- | None Listed On Document | |
| Dundore Corin | -- | -- | |
| Tirado Daphne C | -- | -- | |
| Crockett Marilu Gibbons | -- | -- |
Source: Public Records
Tax History Compared to Growth
Tax History
| Year | Tax Paid | Tax Assessment Tax Assessment Total Assessment is a certain percentage of the fair market value that is determined by local assessors to be the total taxable value of land and additions on the property. | Land | Improvement |
|---|---|---|---|---|
| 2025 | $3,998 | $331,800 | $250,100 | $81,700 |
| 2024 | $3,812 | $331,800 | $250,100 | $81,700 |
| 2023 | $3,514 | $331,800 | $250,100 | $81,700 |
| 2022 | $3,514 | $331,800 | $250,100 | $81,700 |
| 2021 | $3,497 | $331,800 | $250,100 | $81,700 |
| 2020 | $3,507 | $331,800 | $250,100 | $81,700 |
| 2019 | $3,510 | $331,800 | $250,100 | $81,700 |
| 2018 | $3,517 | $331,800 | $250,100 | $81,700 |
| 2017 | $3,288 | $331,800 | $250,100 | $81,700 |
| 2016 | $3,090 | $279,100 | $207,000 | $72,100 |
| 2015 | $3,014 | $279,100 | $207,000 | $72,100 |
| 2014 | $3,012 | $268,300 | $207,000 | $61,300 |
Source: Public Records
Map
Nearby Homes
- 2109 Central Ave
- 1903 Pennsylvania Ave
- 1810 Central Ave Unit 15
- 1810 Central Ave Unit 17
- 111 W 18th St Unit 2
- 1219 Long Beach Blvd
- 109 W 26th St
- 1306 Barnegat Ave
- 108 W 10th St
- 1001 Ocean Ave Unit 1017
- 1001 Ocean Ave Unit 1012
- 1001 Ocean Ave Unit C1001
- 615 Barnegat Ave
- 3608B Long Beach Blvd
- 605 Long Beach Blvd
- 3700 W 38th St
- 2 Northeast Dr
- 2572 E East Bay Ave
- 2561 2nd St
- 5 W 40th St