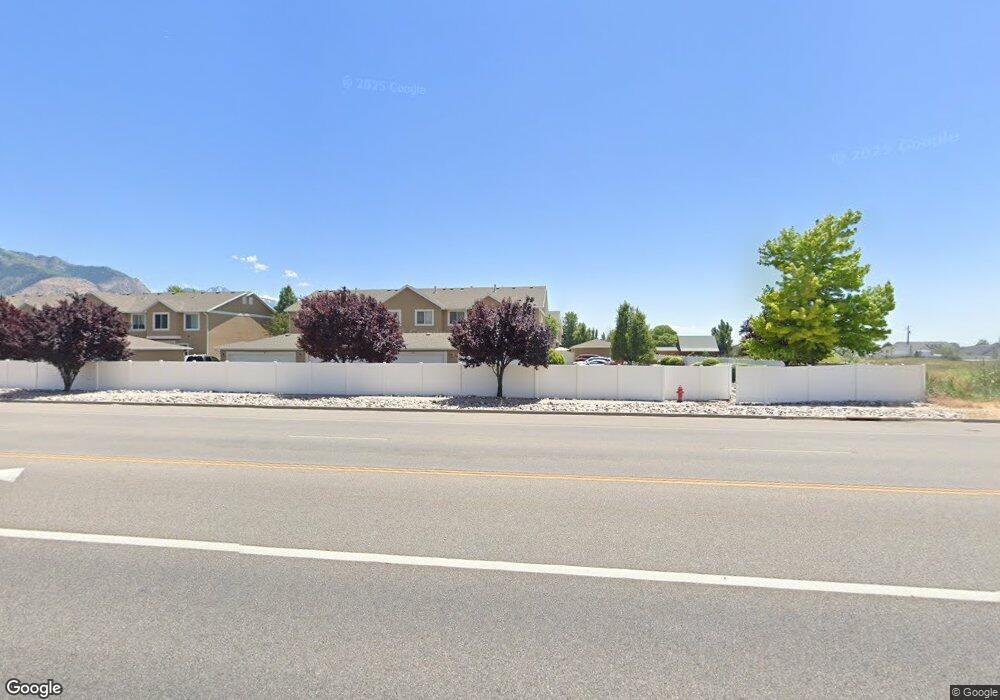
255 W 2700 N Unit 12 Pleasant View, UT 84414
Estimated Value: $355,000 - $373,000
3
Beds
3
Baths
1,620
Sq Ft
$225/Sq Ft
Est. Value
About This Home
This home is located at 255 W 2700 N Unit 12, Pleasant View, UT 84414 and is currently estimated at $364,426, approximately $224 per square foot. 255 W 2700 N Unit 12 is a home located in Weber County with nearby schools including Majestic Elementary School, Orion Junior High School, and Weber High School.
Ownership History
Date
Name
Owned For
Owner Type
Purchase Details
Closed on
Dec 11, 2023
Sold by
Fully Eduardo M
Bought by
Fully Eduardo M and Fully Amanda
Current Estimated Value
Home Financials for this Owner
Home Financials are based on the most recent Mortgage that was taken out on this home.
Original Mortgage
$357,525
Outstanding Balance
$351,913
Interest Rate
7.79%
Mortgage Type
VA
Estimated Equity
$12,513
Purchase Details
Closed on
Apr 13, 2023
Sold by
Sandstrom Carol H
Bought by
Walborn Katherine M
Purchase Details
Closed on
Nov 27, 2013
Sold by
Westates Investments Llc
Bought by
Sandstrom Ronald L and Sandstrom Carol H
Home Financials for this Owner
Home Financials are based on the most recent Mortgage that was taken out on this home.
Original Mortgage
$145,658
Interest Rate
4.23%
Mortgage Type
New Conventional
Create a Home Valuation Report for This Property
The Home Valuation Report is an in-depth analysis detailing your home's value as well as a comparison with similar homes in the area
Home Values in the Area
Average Home Value in this Area
Purchase History
| Date | Buyer | Sale Price | Title Company |
|---|---|---|---|
| Fully Eduardo M | -- | First American Title | |
| Fully Eduardo M | -- | Stewart Title | |
| Walborn Katherine M | -- | Stewart Title | |
| Sandstrom Ronald L | -- | Hickman Land Title Co |
Source: Public Records
Mortgage History
| Date | Status | Borrower | Loan Amount |
|---|---|---|---|
| Open | Fully Eduardo M | $357,525 | |
| Previous Owner | Sandstrom Ronald L | $145,658 |
Source: Public Records
Tax History Compared to Growth
Tax History
| Year | Tax Paid | Tax Assessment Tax Assessment Total Assessment is a certain percentage of the fair market value that is determined by local assessors to be the total taxable value of land and additions on the property. | Land | Improvement |
|---|---|---|---|---|
| 2025 | $2,362 | $366,224 | $70,000 | $296,224 |
| 2024 | $2,098 | $197,448 | $38,500 | $158,948 |
| 2023 | $2,013 | $345,000 | $70,000 | $275,000 |
| 2022 | $2,077 | $199,650 | $38,500 | $161,150 |
| 2021 | $1,629 | $266,000 | $50,000 | $216,000 |
| 2020 | $1,542 | $232,999 | $35,000 | $197,999 |
| 2019 | $1,517 | $219,002 | $35,000 | $184,002 |
| 2018 | $1,380 | $191,000 | $28,000 | $163,000 |
| 2017 | $1,261 | $165,100 | $26,000 | $139,100 |
| 2016 | $1,193 | $85,250 | $13,750 | $71,500 |
| 2015 | $1,112 | $79,200 | $13,750 | $65,450 |
| 2014 | $1,130 | $79,200 | $13,750 | $65,450 |
Source: Public Records
Map
Nearby Homes
- 255 W 2700 N Unit 31
- 255 W 2700 N Unit 51
- 145 W 2525 N
- 212 Rose Anne Cir
- 2517 N Dorchester Ave
- 157 Arlington Way
- 2448 Wellington Dr
- 121 Arlington Way
- 2474 N Dorchester Ave
- 123 Hillsborough Dr Unit 71
- 2393 Wellington Dr
- 22 Hillsborough Dr
- 307 Willow Way
- 69 White Barn Dr
- 2540 N 450 W
- 1260 N 350 W Unit 160
- 1266 N 350 W Unit 159
- 1272 N 350 W Unit 158
- 1278 N 375 W Unit 152
- 48 White Barn Dr
- 255 W 2700 N Unit 2
- 255 W 2700 N Unit 55
- 255 W 2700 N Unit 54
- 255 W 2700 N Unit 1
- 255 W 2700 N Unit 51
- 255 W 2700 N Unit 53
- 255 W 2700 N Unit 25
- 255 W 2700 N Unit 1
- 255 W 2700 N Unit 6
- 255 W 2700 N Unit 13
- 255 W 2700 N Unit 41
- 255 W 2700 N Unit 19
- 255 W 2700 N Unit 37
- 255 W 2700 N Unit 28
- 255 W 2700 N Unit 55
- 255 W 2700 N Unit 20
- 255 W 2700 N Unit 36
- 255 W 2700 N Unit 14
- 255 W 2700 N Unit 35
- 255 W 2700 N Unit 27