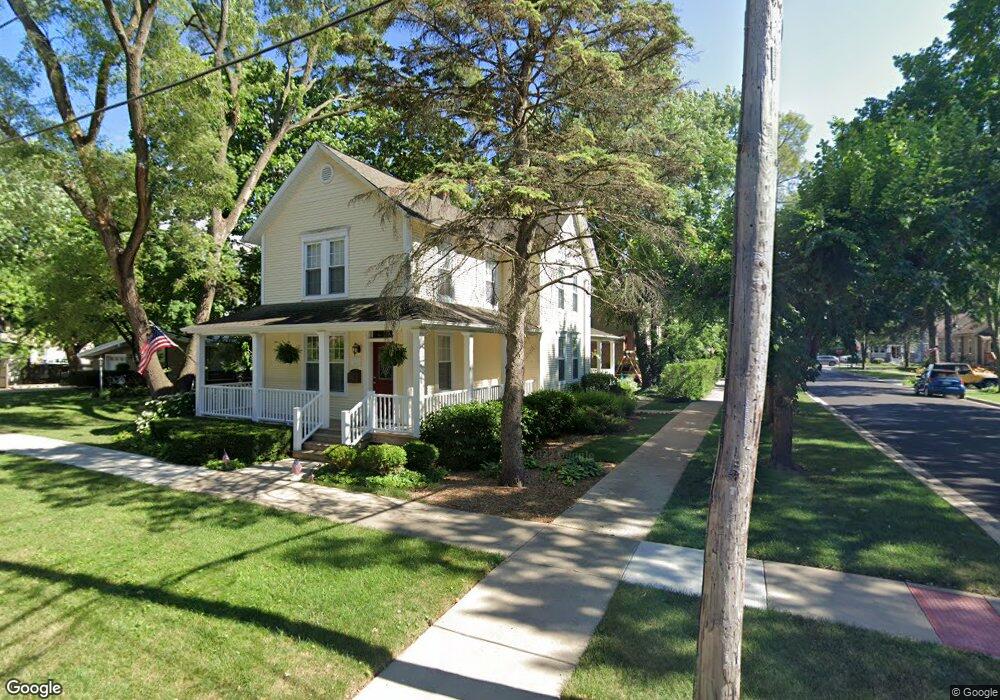
255 W Slade St Palatine, IL 60067
Downtown Palatine NeighborhoodEstimated Value: $557,000 - $739,000
7
Beds
3
Baths
3,018
Sq Ft
$212/Sq Ft
Est. Value
About This Home
This home is located at 255 W Slade St, Palatine, IL 60067 and is currently estimated at $638,377, approximately $211 per square foot. 255 W Slade St is a home located in Cook County with nearby schools including Stuart R Paddock School, Plum Grove Jr High School, and William Fremd High School.
Ownership History
Date
Name
Owned For
Owner Type
Purchase Details
Closed on
Jul 31, 2024
Sold by
Two Branches Llc
Bought by
Sommers Shawn and Sommers Andrea
Current Estimated Value
Home Financials for this Owner
Home Financials are based on the most recent Mortgage that was taken out on this home.
Original Mortgage
$416,000
Outstanding Balance
$397,578
Interest Rate
6.49%
Mortgage Type
New Conventional
Estimated Equity
$240,799
Purchase Details
Closed on
Aug 5, 2016
Sold by
Leckie Brian P and Leckie Jeanne M
Bought by
Two Branches Llc
Purchase Details
Closed on
Aug 29, 2006
Sold by
Ebsen Paul B and Ebsen Eleanor C
Bought by
Leckie Brian and Leckie Jeanne M
Home Financials for this Owner
Home Financials are based on the most recent Mortgage that was taken out on this home.
Original Mortgage
$296,000
Interest Rate
6.36%
Mortgage Type
Unknown
Create a Home Valuation Report for This Property
The Home Valuation Report is an in-depth analysis detailing your home's value as well as a comparison with similar homes in the area
Home Values in the Area
Average Home Value in this Area
Purchase History
| Date | Buyer | Sale Price | Title Company |
|---|---|---|---|
| Sommers Shawn | $520,000 | None Listed On Document | |
| Two Branches Llc | -- | None Available | |
| Leckie Brian | $370,000 | Multiple |
Source: Public Records
Mortgage History
| Date | Status | Borrower | Loan Amount |
|---|---|---|---|
| Open | Sommers Shawn | $416,000 | |
| Previous Owner | Leckie Brian | $296,000 |
Source: Public Records
Tax History Compared to Growth
Tax History
| Year | Tax Paid | Tax Assessment Tax Assessment Total Assessment is a certain percentage of the fair market value that is determined by local assessors to be the total taxable value of land and additions on the property. | Land | Improvement |
|---|---|---|---|---|
| 2024 | $13,821 | $50,000 | $5,227 | $44,773 |
| 2023 | $13,340 | $50,000 | $5,227 | $44,773 |
| 2022 | $13,340 | $50,000 | $5,227 | $44,773 |
| 2021 | $13,157 | $43,843 | $3,049 | $40,794 |
| 2020 | $13,034 | $43,843 | $3,049 | $40,794 |
| 2019 | $13,018 | $48,823 | $3,049 | $45,774 |
| 2018 | $9,081 | $32,657 | $2,831 | $29,826 |
| 2017 | $8,928 | $32,657 | $2,831 | $29,826 |
| 2016 | $8,552 | $32,657 | $2,831 | $29,826 |
| 2015 | $8,798 | $31,256 | $2,613 | $28,643 |
| 2014 | $9,281 | $33,147 | $2,613 | $30,534 |
| 2013 | $9,026 | $33,147 | $2,613 | $30,534 |
Source: Public Records
Map
Nearby Homes
- 315 Johnson St
- 133 W Palatine Rd Unit 107A
- 435 W Wood St Unit 402A
- Lot 1 W Wilson St
- 390 W Mahogany Ct Unit 606
- 410 W Mahogany Ct Unit 309
- 87 W Station St
- 480 W Wood St Unit 3
- 24 W Station St Unit 403W
- 235 N Smith St Unit 401
- 470 W Mahogany Ct Unit 408
- 566 W Bridge View Ct
- 222 S Maple St
- 2 E Slade St
- 241 N Brockway St
- 4 E Slade St
- 3 E Slade St
- 55 S Hale St Unit 202
- 55 S Hale St Unit 109
- 122 W Helen Rd
- 249 W Slade St
- 15 N Rose St
- 11 N Rose St
- 243 W Slade St
- 303 W Slade St
- 248 W Palatine Rd
- 7 N Rose St Unit 1
- 7 N Rose St
- 242 W Palatine Rd
- 302 W Palatine Rd
- 311 W Slade St
- 248 W Slade St
- 240 W Palatine Rd
- 302 W Slade St
- 310 W Palatine Rd
- 225 W Slade St
- 315 W Slade St
- 308 W Slade St
- 240 W Slade St
- 226 W Palatine Rd Unit 1