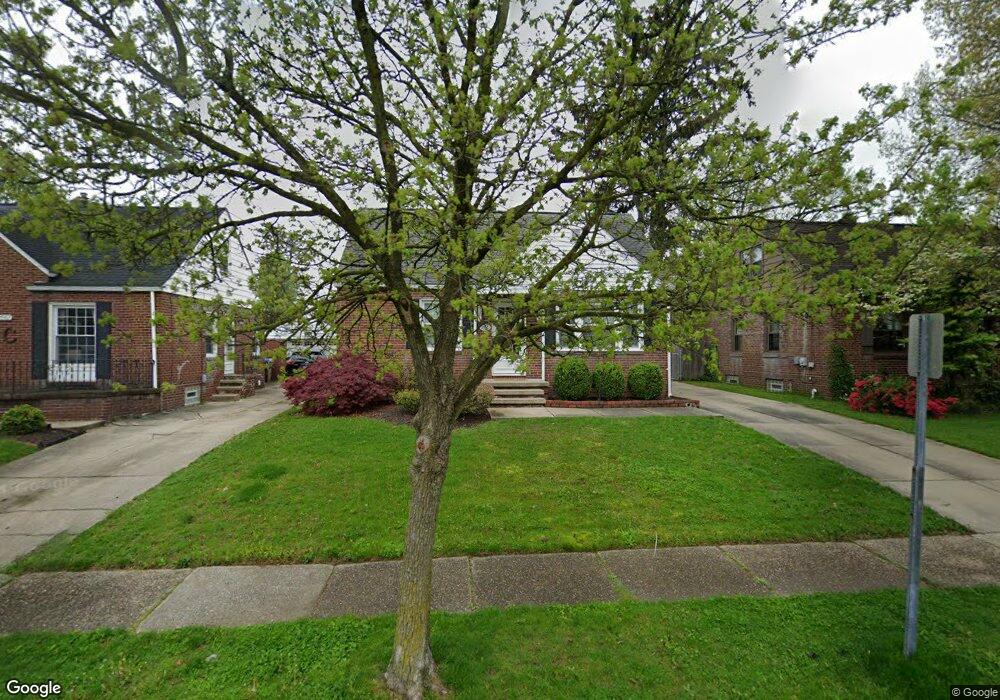
2550 9th St Cuyahoga Falls, OH 44221
Mud Brook NeighborhoodEstimated Value: $140,000 - $173,581
2
Beds
1
Bath
768
Sq Ft
$204/Sq Ft
Est. Value
About This Home
This home is located at 2550 9th St, Cuyahoga Falls, OH 44221 and is currently estimated at $156,395, approximately $203 per square foot. 2550 9th St is a home located in Summit County with nearby schools including Dewitt Elementary School, Bolich Middle School, and Cuyahoga Falls High School.
Ownership History
Date
Name
Owned For
Owner Type
Purchase Details
Closed on
Sep 25, 2020
Sold by
Doris M Collins Revocable Living Trust
Bought by
Collins Christopher M
Current Estimated Value
Purchase Details
Closed on
Aug 19, 2020
Sold by
Doris M Collins Revocable Living Trust and Collins Doris M
Bought by
Collins Christopher M
Purchase Details
Closed on
Dec 17, 2002
Sold by
Collins Doris M
Bought by
Collins Doris M and The Doris M Collins Family Revocable Liv
Create a Home Valuation Report for This Property
The Home Valuation Report is an in-depth analysis detailing your home's value as well as a comparison with similar homes in the area
Home Values in the Area
Average Home Value in this Area
Purchase History
| Date | Buyer | Sale Price | Title Company |
|---|---|---|---|
| Collins Christopher M | $1,000 | Delahunty Martin S | |
| Collins Christopher M | $1,000 | Delahunty Martin S | |
| Collins Doris M | -- | -- |
Source: Public Records
Tax History Compared to Growth
Tax History
| Year | Tax Paid | Tax Assessment Tax Assessment Total Assessment is a certain percentage of the fair market value that is determined by local assessors to be the total taxable value of land and additions on the property. | Land | Improvement |
|---|---|---|---|---|
| 2025 | $2,645 | $48,997 | $9,398 | $39,599 |
| 2024 | $2,645 | $48,997 | $9,398 | $39,599 |
| 2023 | $2,645 | $48,997 | $9,398 | $39,599 |
| 2022 | $2,459 | $37,002 | $7,014 | $29,988 |
| 2021 | $2,597 | $39,074 | $7,014 | $32,060 |
| 2020 | $2,612 | $39,070 | $7,010 | $32,060 |
| 2019 | $2,472 | $33,690 | $7,010 | $26,680 |
| 2018 | $1,520 | $33,690 | $7,010 | $26,680 |
| 2017 | $1,281 | $33,690 | $7,010 | $26,680 |
| 2016 | $1,282 | $30,050 | $7,010 | $23,040 |
| 2015 | $1,281 | $30,050 | $7,010 | $23,040 |
| 2014 | $1,281 | $30,050 | $7,010 | $23,040 |
| 2013 | $1,418 | $32,520 | $7,010 | $25,510 |
Source: Public Records
Map
Nearby Homes