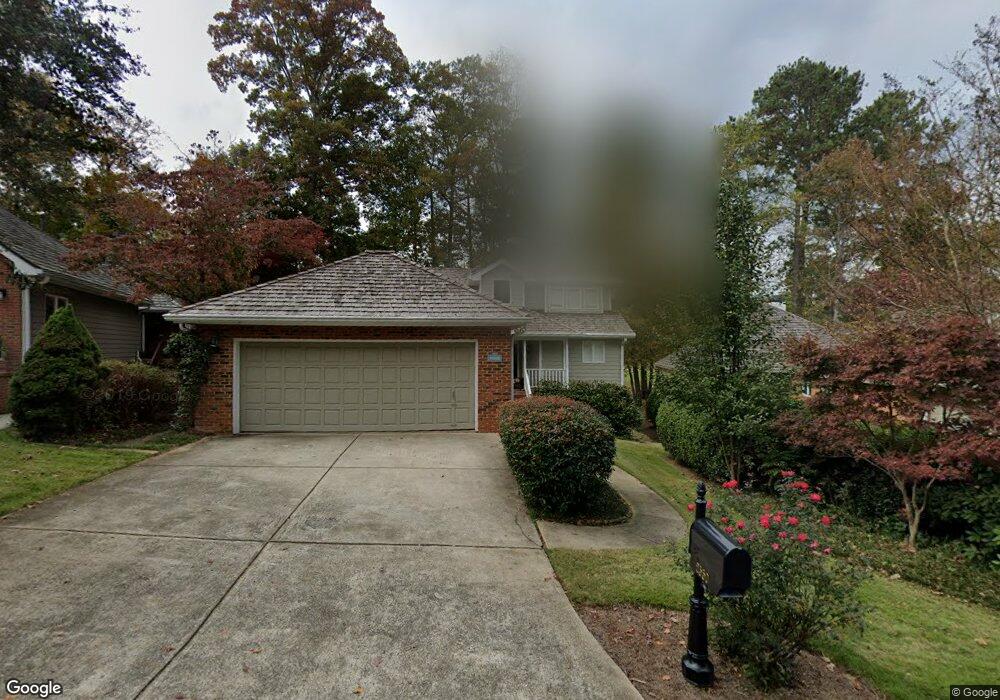
2550 Camden Glen Ct Unit 13 Roswell, GA 30076
Willow Springs NeighborhoodEstimated Value: $663,000 - $781,000
3
Beds
3
Baths
2,614
Sq Ft
$269/Sq Ft
Est. Value
About This Home
This home is located at 2550 Camden Glen Ct Unit 13, Roswell, GA 30076 and is currently estimated at $702,679, approximately $268 per square foot. 2550 Camden Glen Ct Unit 13 is a home located in Fulton County with nearby schools including Northwood Elementary School, Haynes Bridge Middle School, and Centennial High School.
Ownership History
Date
Name
Owned For
Owner Type
Purchase Details
Closed on
Apr 8, 2016
Sold by
Bachelor Kathryn
Bought by
Manuel Florante C and Manuel Lolita A
Current Estimated Value
Home Financials for this Owner
Home Financials are based on the most recent Mortgage that was taken out on this home.
Original Mortgage
$259,200
Outstanding Balance
$205,919
Interest Rate
3.68%
Estimated Equity
$496,760
Purchase Details
Closed on
Nov 20, 2014
Sold by
Suntrust Bank Trustee
Bought by
Nall James and Nall Donna
Purchase Details
Closed on
Jul 18, 2000
Sold by
Way Charles S
Bought by
Feagin Rose E
Home Financials for this Owner
Home Financials are based on the most recent Mortgage that was taken out on this home.
Original Mortgage
$100,000
Interest Rate
8.3%
Mortgage Type
New Conventional
Purchase Details
Closed on
Sep 12, 1997
Sold by
Mccoy Edward W and Mccoy Diane L
Bought by
Way Chas S
Create a Home Valuation Report for This Property
The Home Valuation Report is an in-depth analysis detailing your home's value as well as a comparison with similar homes in the area
Home Values in the Area
Average Home Value in this Area
Purchase History
| Date | Buyer | Sale Price | Title Company |
|---|---|---|---|
| Manuel Florante C | $324,000 | -- | |
| Nall James | $300,000 | -- | |
| Feagin Rose E | $253,500 | -- | |
| Way Chas S | $214,500 | -- |
Source: Public Records
Mortgage History
| Date | Status | Borrower | Loan Amount |
|---|---|---|---|
| Open | Manuel Florante C | $259,200 | |
| Previous Owner | Feagin Rose E | $100,000 | |
| Closed | Way Chas S | -- |
Source: Public Records
Tax History Compared to Growth
Tax History
| Year | Tax Paid | Tax Assessment Tax Assessment Total Assessment is a certain percentage of the fair market value that is determined by local assessors to be the total taxable value of land and additions on the property. | Land | Improvement |
|---|---|---|---|---|
| 2025 | $888 | $210,960 | $51,320 | $159,640 |
| 2023 | $5,791 | $205,160 | $41,560 | $163,600 |
| 2022 | $4,118 | $205,160 | $41,560 | $163,600 |
| 2021 | $4,861 | $188,720 | $30,520 | $158,200 |
| 2020 | $4,941 | $194,280 | $30,920 | $163,360 |
| 2019 | $774 | $190,840 | $30,360 | $160,480 |
| 2018 | $4,231 | $162,360 | $26,400 | $135,960 |
| 2017 | $2,856 | $111,360 | $19,360 | $92,000 |
| 2016 | $2,840 | $111,360 | $19,360 | $92,000 |
| 2015 | $3,673 | $105,680 | $19,360 | $86,320 |
| 2014 | $1,770 | $105,680 | $19,360 | $86,320 |
Source: Public Records
Map
Nearby Homes
- 10280 Crescent Ridge Dr
- 105 May Glen Way
- 485 Sheringham Ct
- 590 Sheringham Ct
- 435 Sheringham Terrace
- 1095 Northpointe Trace
- 105 Laurel Mill Ct
- 3040 Roxburgh Dr
- 10530 Haynes Forest Dr
- 780 Crab Orchard Dr
- 970 Laurel Mill Dr
- 295 Crab Orchard Way
- 615 Barrington Way
- 680 Barrington Way
- 2020 Jardin Ct Unit 1
- 530 Kearny St
- 500 Barrington Dr W
- 515 Forest Place
- 2560 Camden Glen Ct
- 2540 Camden Glen Ct
- 2570 Camden Glen Ct
- 2530 Camden Glen Ct Unit 13
- 2520 Camden Glen Ct Unit 13
- 2580 Camden Glen Ct Unit 13
- 0 Camden Glen Ct
- 2510 Camden Glen Ct
- 2590 Camden Glen Ct
- 2500 Camden Glen Ct
- 2525 Camden Glen Ct
- 2535 Camden Glen Ct Unit 13
- 2600 Camden Glen Ct
- 2545 Camden Glen Ct
- 2515 Camden Glen Ct
- 2545 Camden Ct Unit 2545
- 2545 Camden Ct
- 2545 Camden Ct
- 2490 Camden Glen Ct Unit 13
- 2610 Camden Glen Ct