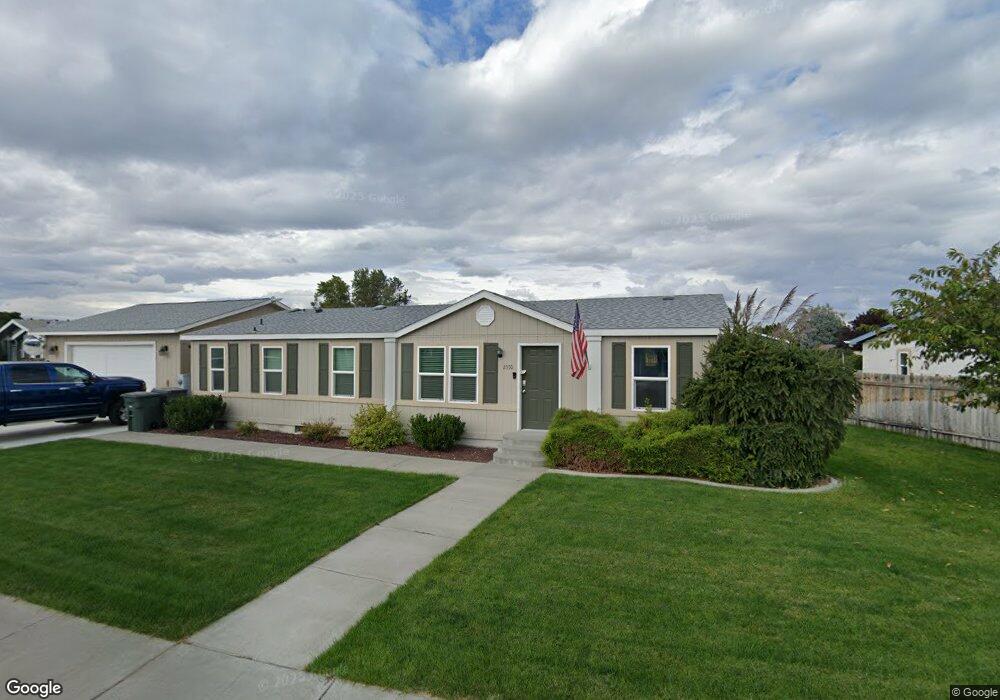
2550 Glenbriar Ln Unit Multiple Offers Richland, WA 99352
Estimated Value: $320,000 - $361,000
2
Beds
2
Baths
1,426
Sq Ft
$241/Sq Ft
Est. Value
About This Home
This home is located at 2550 Glenbriar Ln Unit Multiple Offers, Richland, WA 99352 and is currently estimated at $343,174, approximately $240 per square foot. 2550 Glenbriar Ln Unit Multiple Offers is a home located in Benton County with nearby schools including Tapteal Elementary School, Carmichael Middle School, and Hanford High School.
Ownership History
Date
Name
Owned For
Owner Type
Purchase Details
Closed on
May 17, 2016
Sold by
Tuck Shaun D and Tuck Jaime M
Bought by
Priser Terrence and Priser Janet
Current Estimated Value
Home Financials for this Owner
Home Financials are based on the most recent Mortgage that was taken out on this home.
Original Mortgage
$101,250
Outstanding Balance
$80,418
Interest Rate
3.59%
Mortgage Type
VA
Estimated Equity
$262,756
Purchase Details
Closed on
Nov 21, 2008
Sold by
Tuck Jamie M and Hawkins Jamie M
Bought by
Tuck Jamie M and Tuck Shaun D
Home Financials for this Owner
Home Financials are based on the most recent Mortgage that was taken out on this home.
Original Mortgage
$101,753
Interest Rate
6.37%
Mortgage Type
FHA
Purchase Details
Closed on
Aug 25, 2006
Sold by
Hughes Michael C and Hughes Margaret J
Bought by
Hawkins Jaime M
Home Financials for this Owner
Home Financials are based on the most recent Mortgage that was taken out on this home.
Original Mortgage
$4,000
Interest Rate
6.67%
Mortgage Type
Stand Alone Second
Create a Home Valuation Report for This Property
The Home Valuation Report is an in-depth analysis detailing your home's value as well as a comparison with similar homes in the area
Home Values in the Area
Average Home Value in this Area
Purchase History
| Date | Buyer | Sale Price | Title Company |
|---|---|---|---|
| Priser Terrence | $145,000 | Stewart Title Company | |
| Tuck Jamie M | -- | Frontier Title & Escrow Co | |
| Hawkins Jaime M | $103,000 | Chicago Title |
Source: Public Records
Mortgage History
| Date | Status | Borrower | Loan Amount |
|---|---|---|---|
| Open | Priser Terrence | $101,250 | |
| Previous Owner | Tuck Jamie M | $101,753 | |
| Previous Owner | Hawkins Jaime M | $4,000 | |
| Previous Owner | Hawkins Jaime M | $96,932 |
Source: Public Records
Tax History Compared to Growth
Tax History
| Year | Tax Paid | Tax Assessment Tax Assessment Total Assessment is a certain percentage of the fair market value that is determined by local assessors to be the total taxable value of land and additions on the property. | Land | Improvement |
|---|---|---|---|---|
| 2024 | $2,264 | $205,630 | $60,000 | $145,630 |
| 2023 | $2,264 | $239,230 | $60,000 | $179,230 |
| 2022 | $2,071 | $224,300 | $60,000 | $164,300 |
| 2021 | $1,900 | $185,650 | $60,000 | $125,650 |
| 2020 | $1,414 | $163,500 | $60,000 | $103,500 |
| 2019 | $1,711 | $114,340 | $60,000 | $54,340 |
| 2018 | $1,782 | $149,860 | $35,000 | $114,860 |
| 2017 | $1,518 | $130,720 | $35,000 | $95,720 |
| 2016 | $1,496 | $127,070 | $35,000 | $92,070 |
| 2015 | $1,524 | $127,070 | $35,000 | $92,070 |
| 2014 | -- | $127,070 | $35,000 | $92,070 |
| 2013 | -- | $127,070 | $35,000 | $92,070 |
Source: Public Records
Map
Nearby Homes
- 617 Cottonwood Dr
- 627 Cedar Ave
- 405 Basswood Ave
- 2407 Duportail St
- 733 Tanglewood Dr
- 2402 Dover St
- 2404 Dallas St
- 2109 Duportail St
- 2120 Duportail St Unit 1
- 2305 Concord St
- 711 Cottonwood Loop
- 503 Wright Ave Unit B8
- 505 Winslow Ave
- 513 Winslow Ave
- 667 Lonetree Ln
- 677 Lonetree Ln
- 681 Lonetree Ln
- 692 Lonetree Ln
- 901 Cedar Ave
- 132 Windhaven Ln
- 2550 Glenbriar Ln
- 2534 Glenbriar Ln
- 2558 Glenbriar Ln
- 557 Laurelbrook Ct
- 2543 Glenbriar Ln
- 2551 Glenbriar Ln
- 2559 Glenbriar Ln
- 2535 Glenbriar Ln
- 569 Laurelbrook Ct
- 512 Sedgwick Place
- 2527 Glenbriar Ln
- 556 Laurelbrook Ct
- Lot 6 Blk 6 Sedgwick Place
- Lot 3 Blk 6 Sedgwick Place
- 566 Laurelbrook Ct
- 540 Sedgwick Place
- 2567 Glenbriar Ln
- 2519 Glenbriar Ln
- 2519 Glenbriar Ln Unit Immaculate home in g
- 574 Laurelbrook Ct