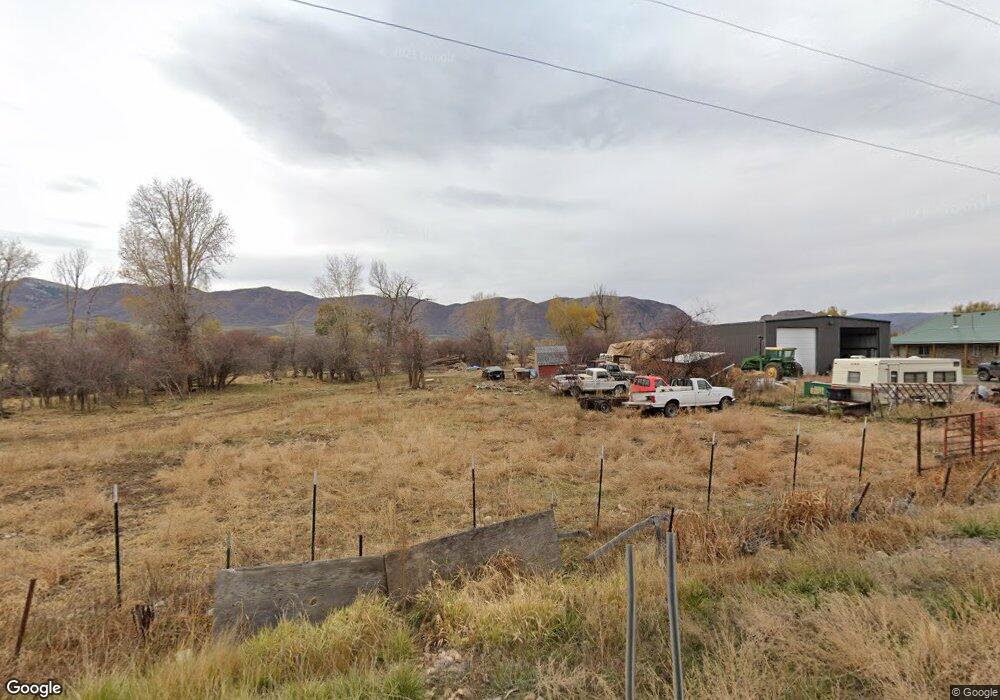
2550 N East Henefer Rd Henefer, UT 84033
Estimated Value: $475,000 - $878,000
2
Beds
3
Baths
2,704
Sq Ft
$272/Sq Ft
Est. Value
About This Home
This home is located at 2550 N East Henefer Rd, Henefer, UT 84033 and is currently estimated at $734,362, approximately $271 per square foot. 2550 N East Henefer Rd is a home located in Summit County with nearby schools including North Summit Middle School, North Summit Elementary School, and North Summit High School.
Ownership History
Date
Name
Owned For
Owner Type
Purchase Details
Closed on
Jun 12, 2018
Sold by
Thurston Todd J and Thurston Becky S
Bought by
Thurston Todd J and Thurston Becky S
Current Estimated Value
Purchase Details
Closed on
Oct 21, 2014
Sold by
Thurston Todd J and Thurston Becky S
Bought by
Stephens Kyle R and The Edison J Stephens Family Trust
Home Financials for this Owner
Home Financials are based on the most recent Mortgage that was taken out on this home.
Original Mortgage
$95,000
Outstanding Balance
$31,870
Interest Rate
4.1%
Mortgage Type
New Conventional
Estimated Equity
$702,492
Purchase Details
Closed on
Oct 17, 2014
Sold by
Stephens Kyle R
Bought by
Thurston Todd J and Thurston Becky S
Home Financials for this Owner
Home Financials are based on the most recent Mortgage that was taken out on this home.
Original Mortgage
$95,000
Outstanding Balance
$31,870
Interest Rate
4.1%
Mortgage Type
New Conventional
Estimated Equity
$702,492
Create a Home Valuation Report for This Property
The Home Valuation Report is an in-depth analysis detailing your home's value as well as a comparison with similar homes in the area
Home Values in the Area
Average Home Value in this Area
Purchase History
| Date | Buyer | Sale Price | Title Company |
|---|---|---|---|
| Thurston Todd J | -- | None Available | |
| Stephens Kyle R | -- | Mountain View Title | |
| Thurston Todd J | -- | Mountain View Title |
Source: Public Records
Mortgage History
| Date | Status | Borrower | Loan Amount |
|---|---|---|---|
| Open | Thurston Todd J | $95,000 |
Source: Public Records
Tax History Compared to Growth
Tax History
| Year | Tax Paid | Tax Assessment Tax Assessment Total Assessment is a certain percentage of the fair market value that is determined by local assessors to be the total taxable value of land and additions on the property. | Land | Improvement |
|---|---|---|---|---|
| 2024 | $2,055 | $335,854 | $68,191 | $267,663 |
| 2023 | $2,055 | $370,475 | $61,991 | $308,484 |
| 2022 | $1,725 | $266,369 | $52,366 | $214,003 |
| 2021 | $1,753 | $223,177 | $52,366 | $170,811 |
| 2020 | $1,769 | $215,150 | $41,366 | $173,784 |
| 2019 | $1,702 | $349,556 | $65,116 | $284,440 |
| 2018 | $1,571 | $164,122 | $35,878 | $128,244 |
| 2017 | $1,275 | $164,137 | $35,893 | $128,244 |
| 2016 | $1,553 | $164,137 | $35,893 | $128,244 |
| 2015 | $1,412 | $164,137 | $0 | $0 |
Source: Public Records
Map
Nearby Homes
- 510 N Main St
- 125 E Canyon Rd
- 335 Memorial Park Rd
- 209 E Main St
- 0 S Echo Frontage Rd
- 12602 Skyline Rd Unit 130
- 141 Sky Line Rd Unit 141
- 10976 Skyline Rd Unit 202
- 1290 S Echo Rd
- 29 N Commercial St
- 192 S Finch Cir
- 269 River Cove Dr
- 77 N River Cove Cir
- 370 S State St
- 733 N Jenny Ln
- 845 N Sapphire St
- 834 N Sapphire St
- 846 N Sapphire St
- 881 Violet Dr
- 793 Ruby Dr